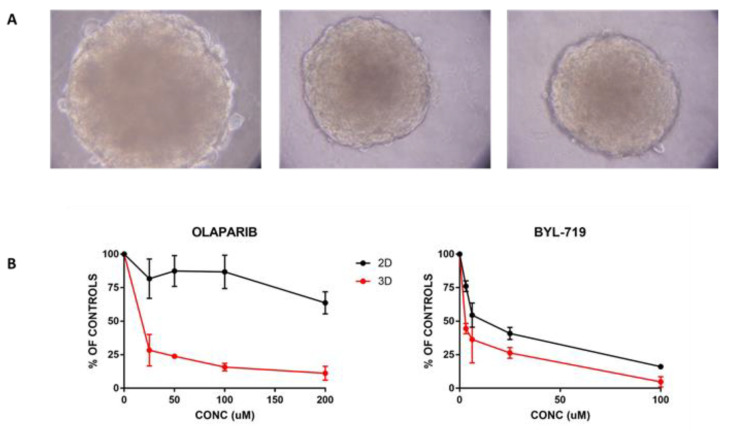
Figure 5.
In vitro 3D growth and response to treatment. (A) Representative images (taken at 40× magnification) of 3D spheres obtained by plating MESO15 cells in ULA plates. (B) Comparison of response of MESO15 cells to BYL719 and olaparib in cells growing as monolayer (black line) or 3D spheres (red line). Data are mean and SD of six replicates.

