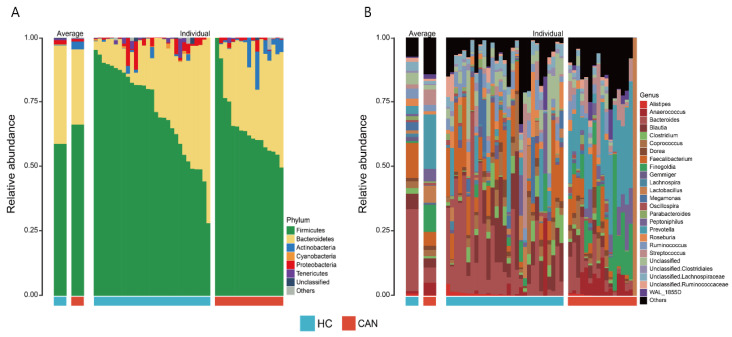
Figure 1.
Relative abundance of fecal microbiota composition at the phylum (A) and genus (B) levels by health statuses (HC vs. CAN). The left panel of each figure represents the average relative abundance. The right panel displays the individual relative abundance of each sample. The top seven phyla and top 25 genera are presented.

