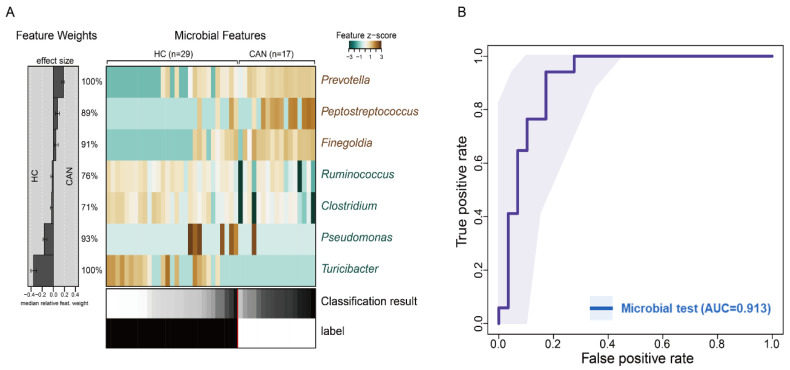
Figure 6.
Machine learning analysis. (A) Relative abundance of seven fecal-derived genera potentially associated with ICC is presented as a heatmap. The effect size of each marker genera for the classification is displayed to the left. (B) Mean test prediction accuracy measured by the area under the ROC curve (AUC).

