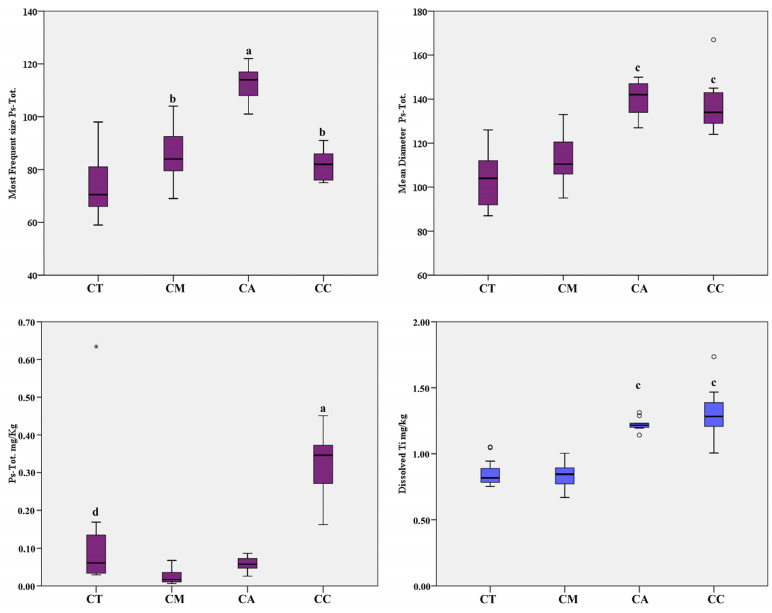
Figure 1.
Box-plot distribution of TiO2-Ps-Tot modal size (nm), mean diameter (nm), level of Ps-Tot, and dissolved Ti (mg/kg) in packaged seafood products. Legend: CT, canned tuna; CM, canned mackerel; CA, canned anchovy; CC, canned clam; a, p < 0.001 vs. all; b, p < 0.05 vs. CT; c, p < 0.001 vs. CT and CM; d p < 0.05 vs. CM and CA. ° Outliers values of the distribution. * Extreme values of the distribution.

