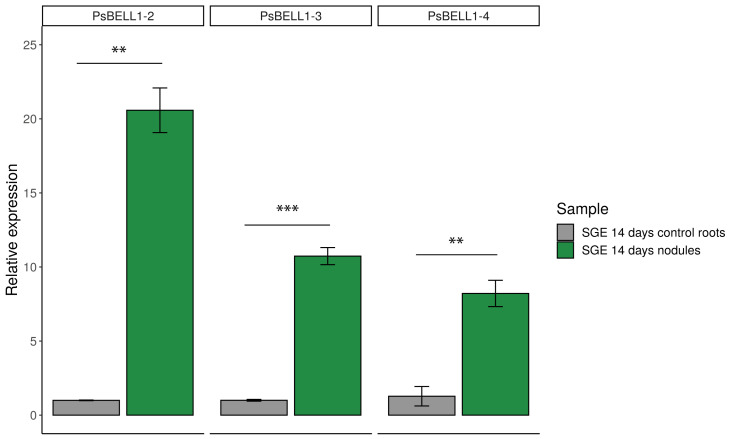
Figure 3.
RT-qPCR analysis of PsBELL1-2 (Psat4g090560), PsBELL1-3 (Psat0s189g0080) and PsBELL1-4 (Psat7g031320) expression in pea nodules (SGE line). mRNA levels were normalized against Ubiquitin and values were calculated as ratios relative to non-inoculated root expression levels (control). The data of three independent biological experiments were analyzed. Bars represent the mean ± SEM. The asterisks indicate a significant induction in nodules relative to control roots based on Student’s t-test analysis (** p < 0.01, *** p < 0.001).

