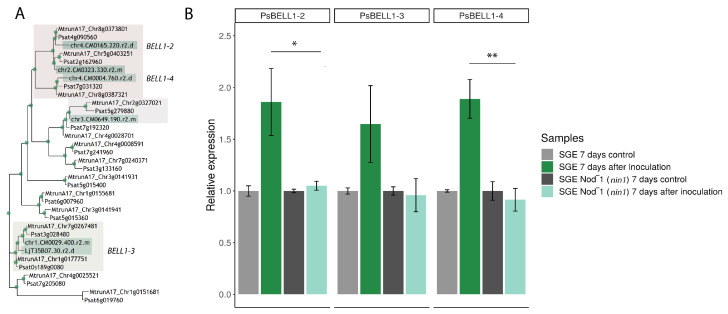
Figure 4.
Phylogenetic tree constructed by the maximum-likelihood method based on amino acid sequences of Medicago truncatula and Pisum sativum BELL genes and Lotus japonicus homologous BELL genes detected in ChIP-Seq analysis. Green dots indicate support more than 70 based on 1000 bootstrap replicates (A). Expression pattern of PsBELL1-2 (Psat4g090560), PsBELL1-3 (Psat0s189g0080) and PsBELL1-4 (Psat7g031320) genes in the roots of pea SGENod−-1 (Psnin-1) mutant and wild type P. sativum cv. SGE (B). mRNA levels were normalized against Ubiquitin and values were calculated as ratios relative to non-inoculated root expression levels (control). The data of three independent biological experiments were analyzed. Bars represent the mean ± SEM. The asterisks indicate statistically significant differences based on one-way analysis of variance (one-way ANOVA), followed by Tukey’s post-hoc test (* p < 0.05; ** p < 0.01).

