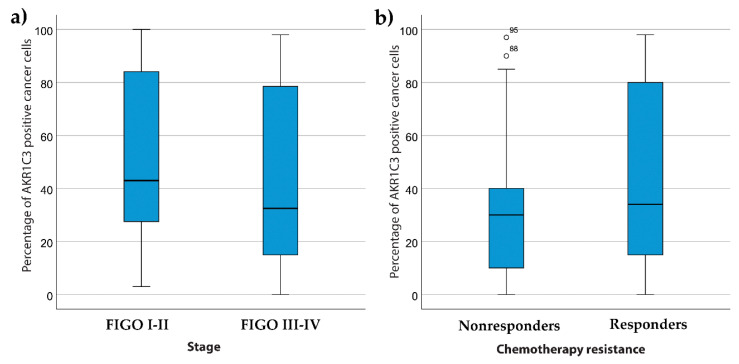
Figure 8.
AKR1C3 distributions between patients with high-grade serous ovarian cancer and FIGO stages (a) and different response to chemotherapy (b). Median values, box from 25th to 75th percentiles, with whiskers that correspond to 25th percentile minus 1.5 times IQR (interquartile range) and to the 75th percentile plus 1.5 IQR are shown.

