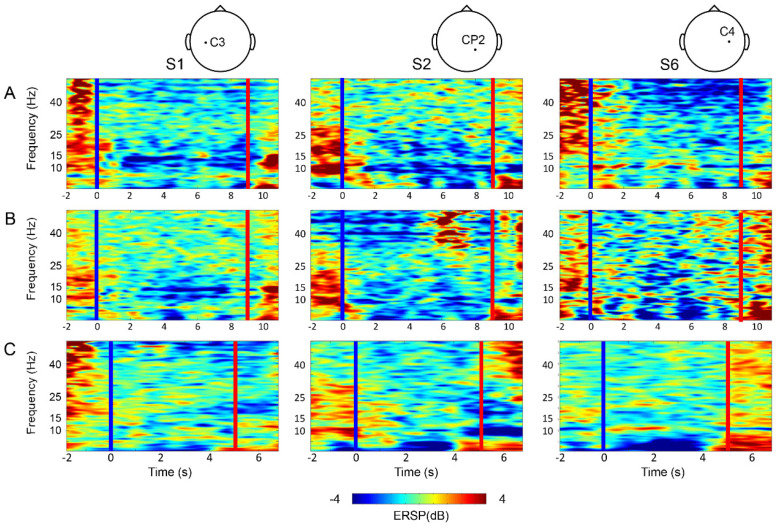
Figure 8.
The event-related spectral perturbation (ERSP) of trial averaged power spectrogram plot; (A) Gait MI, (B) Sit MI, and (C) Do-nothing from top to bottom. The blue vertical line (time 0) represents cue onset, and the red line depicts offset. Subjects engage MIs at time 1 to 9 s and Do-nothing at 1 to 5 s.

