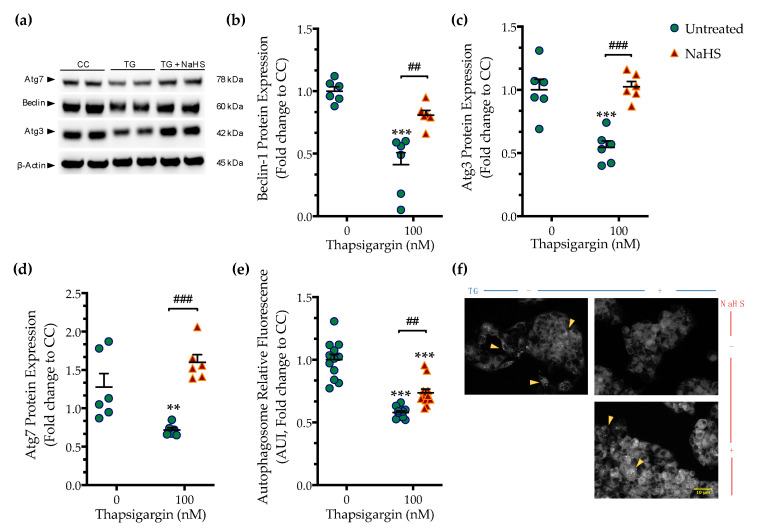
Figure 5.
NaHS co-treatment rescues the arrested autophagy following chronic ER stress. HepG2 cells were serum-starved for 8 h and treated with the vehicle or 100 nM of thapsigargin (TG), in the presence or absence of 100 µM NaHS for 16 h. Cells were harvested, and the extracted protein was processed for Western blotting analysis of the expression levels of beclin-1 (a,b), Atg3 (a,c), and Atg7 (a,d). Alternatively, cells were incubated with the Autophagosome Detection Reagent working solution for 30 min at 37 °C with a humidified incubator with 5% CO2 and 95% air. Cells were washed thrice and the fluorescence signal was read with an Infinite®200 PRO microplate reader (e). Representative images of the labeling were captured under an Olympus CKX53 inverted fluorescent microscope with a DAPI channel (f). Autophagy is indicated by bright dot staining of the autophagic vacuoles (yellow arrowheads). Data are expressed as a fold change of the control (vehicle-treated) conditions (CC). ** p ≤ 0.01, *** p ≤ 0.001 compared to CC; ## p ≤ 0.01, ### p ≤ 0.001 compared to TG-treated cells. For the abbreviations used, please refer to the main text. Scale bar: 10 µm.

