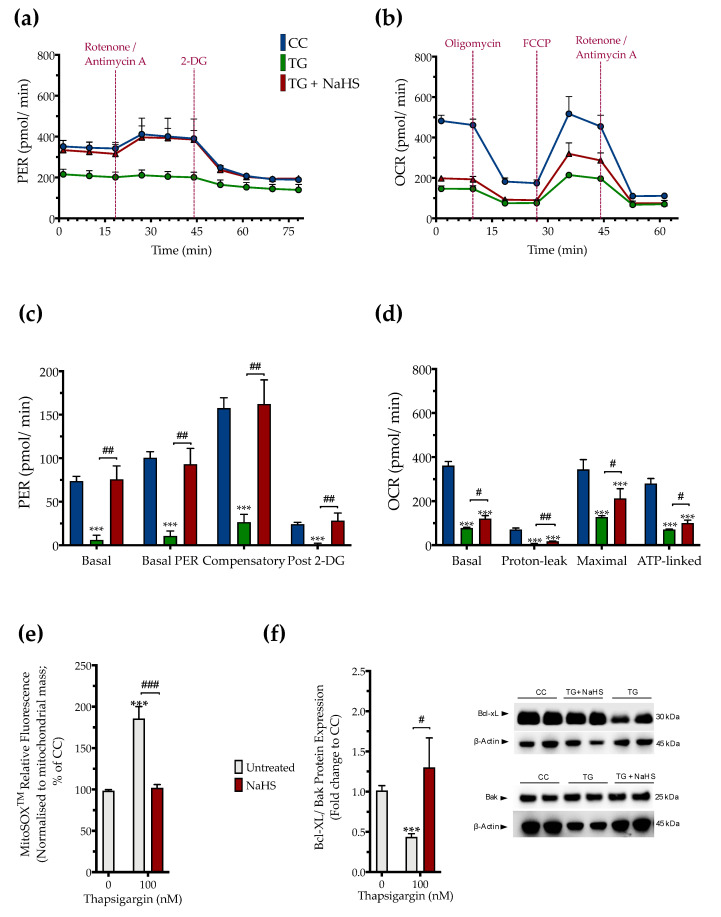
Figure 6.
NaHS improves cellular bioenergetics and reduces mitochondrial oxidant production during ER stress. HepG2 cells were serum-starved for 8 h and treated with the vehicle or 100 nM of thapsigargin (TG), in the presence or absence of 100 µM NaHS for 16 h. We then monitored (a,c) the oxygen consumption rate (OCR) over the sequential injection of oligomycin (1 µM; ATP synthase inhibitor), FCCP (1.5 µM; mitochondrial uncoupler) and of rotenone + antimycin A (0.5 µM; Complex I and III inhibitors) and (b,d) the proton efflux rate (PER) over the sequential injection of rotenone + antimycin A and 2-deoxy-D-glucose (20 mM) with the Seahorse XFe24 Extracellular Flux Analyzer. We have also quantified (e) the relative fluorescence signal of MitoSOX™ red mitochondrial superoxide indicator and (f) the relative expression of Bcl-xL and Bak proteins. Each graph line and bar represent mean ± SEM from four independent experiments. Data are expressed as a fold change of the control (vehicle-treated) conditions (CC). *** p ≤ 0.001 compared to CC; # p ≤ 0.05, ## p ≤ 0.01, ### p ≤ 0.001 compared to the TG-treated cells.

