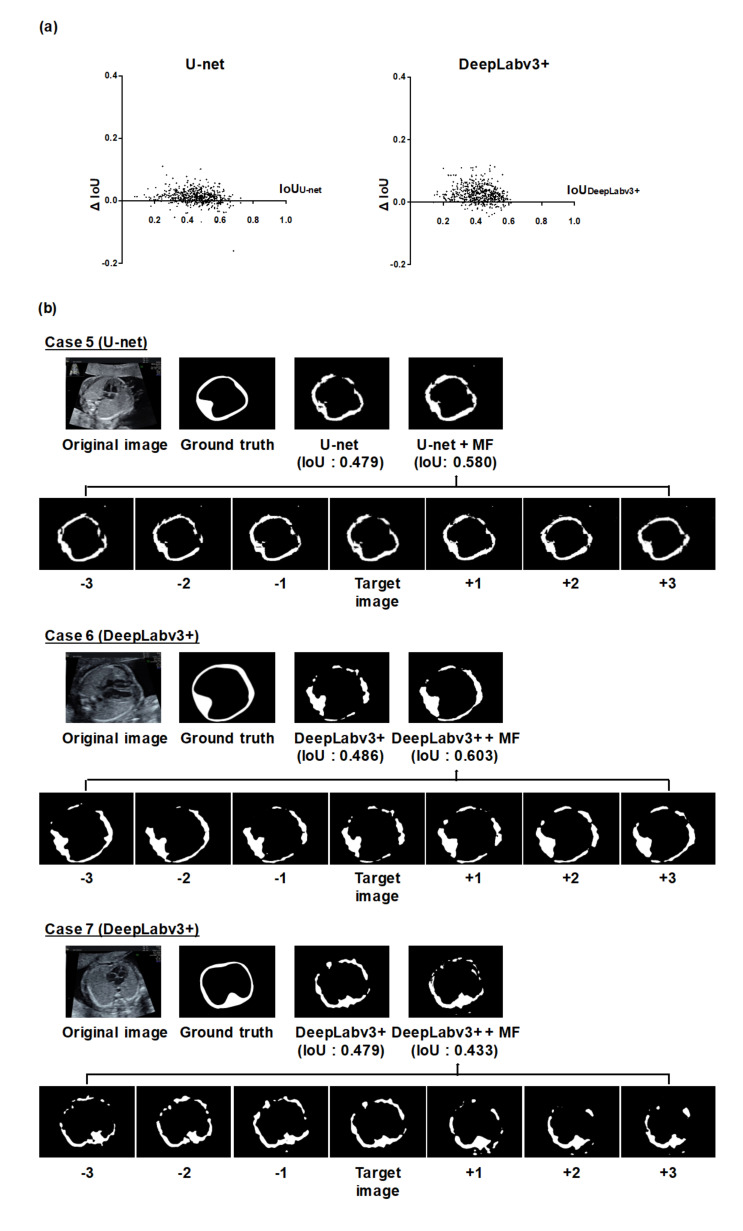
Figure 3.
Analysis of the thoracic wall segmentation in the IoU metric using MF. (a) The differences of the IoU values in all individual images using U-net or DeepLabv3+ and MF. We calculated the IoU of U-net or DeepLabv3+ (IoUU-net or IoUDeepLabv3+), the IoU of MF (IoUMF), and the difference for the IoU values between them (ΔIoU = IoUMF − IoUU-net or IoUDeepLabv3+). CNN models were based on U-net and DeepLabv3+. The x-axis represents the IoUU-net or IoUDeepLabv3+, and the y-axis represents ΔIoU. (b) Representative examples of the thoracic wall segmentation using MF. CNN models were based on U-net (case 5) and DeepLabv3+ (case 6, 7). The upper row of each case presents the prediction labels obtained from U-net or DeepLabv3+ alone and MF. The lower row shows the prediction labels of the neighboring frames integrated by MF. In case 5 and 6, the segmentation performance was improved by MF. On the other hand, in case 7, the segmentation performance worsened by MF.

