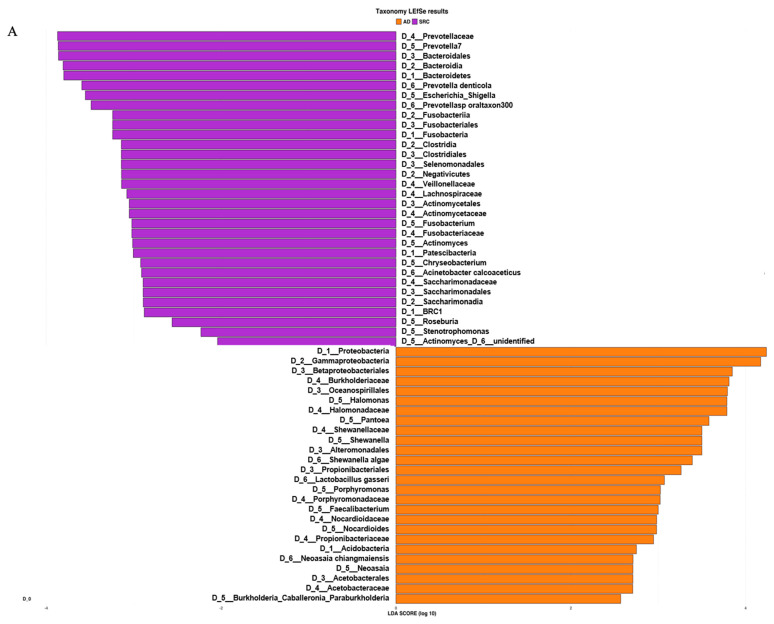
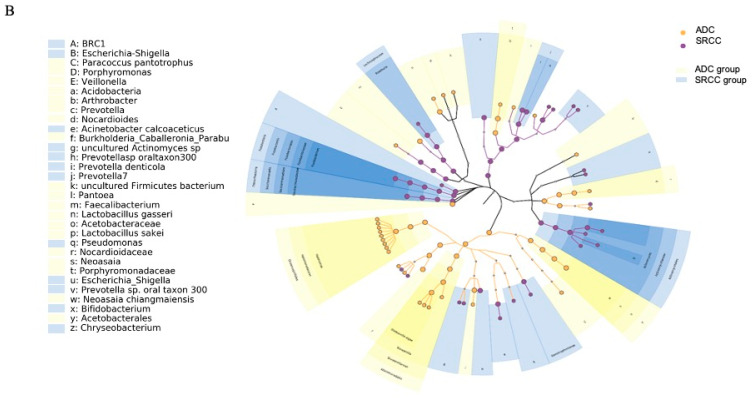
Figure 3.
(A) LEfSe (linear discriminant analysis coupled with effect size) identified the most differentially abundant taxa between ADC, ADC PNT (paired non-tumor), SRCC and SRCC PNT. Only taxa meeting an LDA (linear discriminant analysis) significant threshold of >2 are shown. (B) Taxonomic cladogram obtained from LEfSe analysis of 16S sequences. In particular, two shapes are used to plot the nodes: circle and hexagon, corresponding to taxonomic and ASV clades, respectively. The node bodies are filled if associated to one specific condition following the LEfSe analysis. Moreover, the nodes background is imposed if all the child nodes belong to the same macro-group (i.e., ADC group and SRCC group correspond to tumor and healthy tissues collected from ADC and SRCC subjects, respectively). Unannotated clades correspond to ambiguous taxa in the reference taxonomy (i.e., SILVA).


