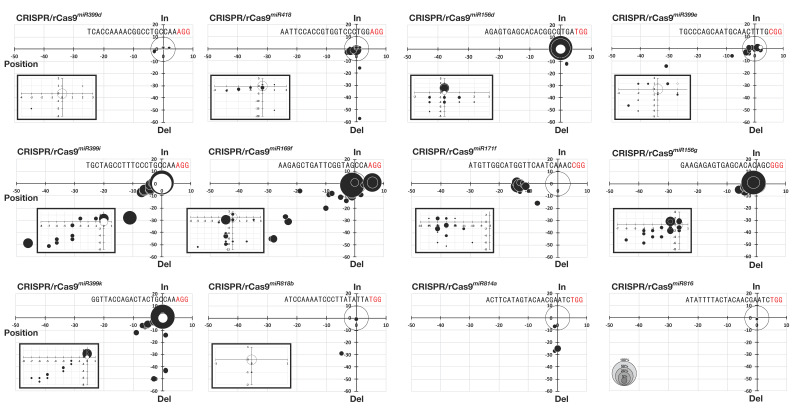
Figure 4.
Patterns and positions of CRISPR/rCas9-mediated base insertion and deletion (Iindel) mutations. The graph shows the correlation between the degree of indel (y-axis) and the position where indel occurs (x-axis). The square in the graph is an enlarged image of the area where spots are concentrated. The white circle at the origin indicates the frequency of non-mutated plants.

