Figure 2.
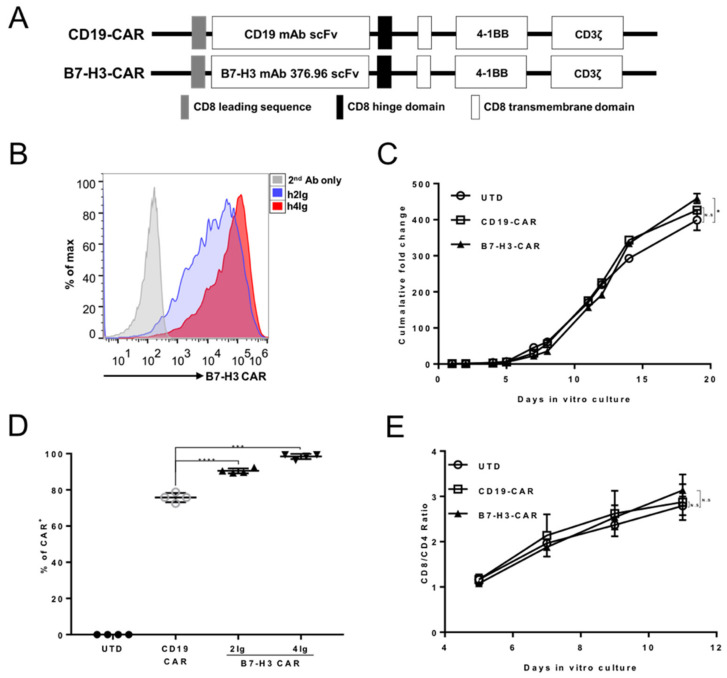
Generation and validation of B7-H3 CAR. (A) Schematic representation of the B7-H3 CAR. (B) The expression of B7-H3 CAR in T cells was evaluated via h2Ig or h4Ig antigens staining (h2Ig shown in blue, h4Ig shown in red). Secondary antibody-only staining served as the control (shown in grey). (C) Expansion kinetics of UTD, CD19, and B7-H3 CAR-T cells in vitro (n = 5). Error bars denote SD (* p = 0.0358, no significant difference showed as N.S). (D) Summary of the CD19 and B7-H3 CAR-T transduction efficiency (n = 4). The horizontal bars represent the mean values. Error bars denote SD (*** p < 0.001, **** p < 0.0001). (E) The CD8/CD4 ratio of in vitro culturing of UTD, CD19, and B7-H3 CAR-T cells at indicated days detected by fluorescence-activated cell sorting (FACS) staining.

