Figure 4.
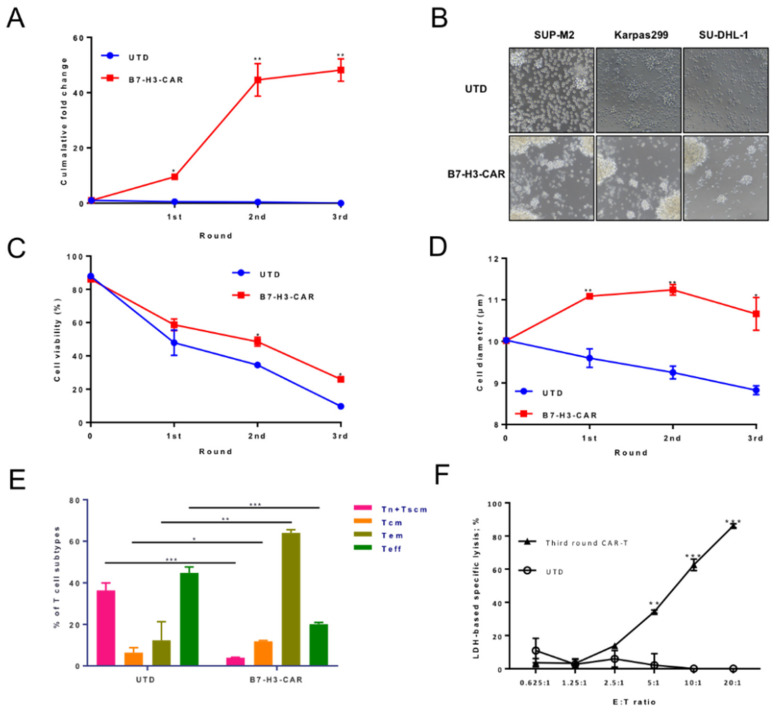
The expansion of B7-H3 redirected CAR-T cells upon repeat antigen stimulations. (A) B7-H3 CAR-T cells were co-cultured with SUP-M2 cell lines at an E:T ratio of 1:1. After every 3 days, CAR-T cells were counted by CD3 FACS staining, and the same number of CAR-T cells were re-plated on a new batch of SUP-M2 cells. The process was repeated for two more stimulations. Cumulative fold expansion of CAR-T cells in each stimulation time point is shown while UTD is the control. (B) Representative microscope images (100×) of UTD (up) and B7-H3 CAR-T (down) co-cultured with SUP-M2, Karpas299, and SU-DHL-1 at a 1:1 ratio after the first round. (C) Cell viabilities in a repeat antigen stimulation assay were measured using trypan blue staining at each time point. (D) Cell diameters in a repeat antigen stimulation assay were measured via a cell counter (CounterStar) at each time point. (E) After the second stimulation, the phenotypes of T cells were flow cytometric quantified based on CD45RA and CD62L staining. The gates were set for effect memory T cells (Tem, CD45RA−CD62L−), central memory T cells (Tcm, CD45RA−CD62L+), naïve T cells (CD45RA+CD62L+), and T effector cells (Teff, CD45RA+CD62L−) [23] in UTD and CAR-T cells (n = 3). Error bars denoted SD. Two-way ANOVA with a t test adjusted p value was calculated between UTD and B7-H3 CAR-T cells (* p < 0.05, ** p < 0.01, *** p < 0.001). (F) The cytotoxicity of B7-H3 CAR-T cells after three rounds of re-stimulation was measured via the LDH assay when co-cultured with SUP-M2 cells at the indicated E: T ratio. In vitro cultured unstimulated UTD served as the control.

