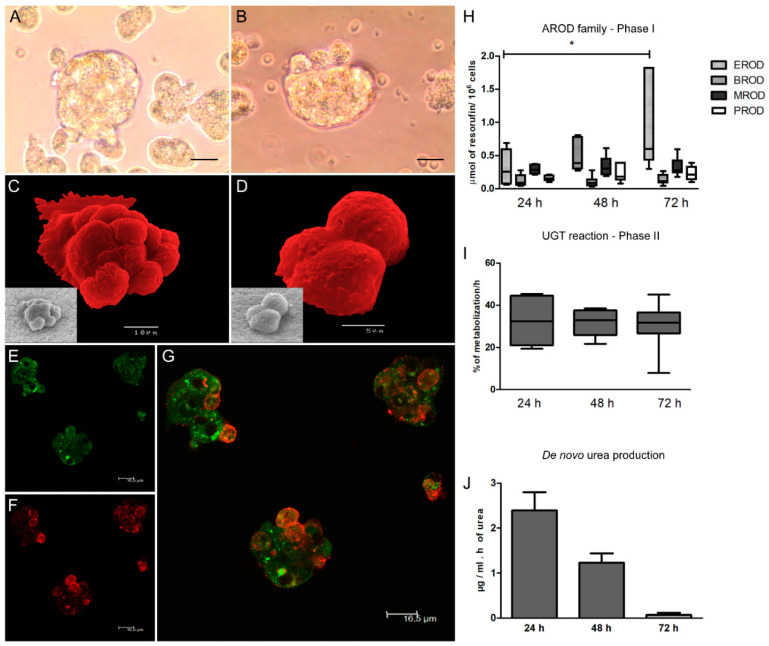
Figure 1.
Morphological and metabolic characterization of the hepatic spheroids. Samples of hepatocytes cultured in a 3D-system for 72 h were observed under an inverted microscope (A,B), (scale bar 20 µm, 400× magnification) and scanning electron microscope (C,D) (scale bar 10 µm and 5 µm, respectively). (C,D) Images were artificially colored to evidence cell morphology. Cellular aggregates exhibit a smooth membrane bound by an extracellular matrix generated by cells. Spheroids stained for actin (green) (E) and ferritin (red) (F) were observed under a fluorescent confocal microscope, and images were acquired. (G) represents the overlapping of actin (E) and ferritin (F) staining (Scale bar 16.5 µm for E, F and G images). Hepatic spheroids with diverse levels of complexity and nearly complete cell fusion can be observed. Nuclei—black spots; actin network—green; ferritin—red. The enzymatic activity of 7-ethoxyresorufin (EROD), 7 benzyloxyresorufin (BROD), 7-methoxyresorufin (MROD), 7-pentoxyresorufin (PROD) (H) of the phase I alkoxyresorufin O-dealkylation (AROD) family, and UGT (I) of phase II represented by box plots, whiskers (minimum to maximum), and urea de novo production (J), expressed by the mean and standard error, were evaluated at 24, 48, and 72 h of 3D-hepatocyte culture. Results of 10 dogs and three replicates per sample are represented. The non-parametric Wilcoxon matched-pairs signed-rank test was applied for statistical comparisons, and * indicates statistical significance values (p < 0.05).

