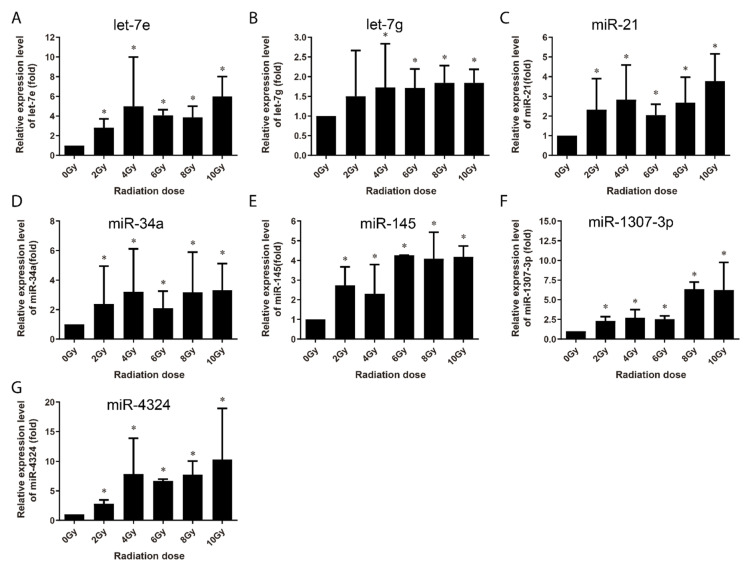
Figure 6.
qRT-PCR verification of the upregulated expression of miRNAs in AHH-1 cell at 24 h after exposure to certain doses (or a dose range) of γ-rays irradiation. (A–G): Respectively representation of the expression changes of let-7e, let-7g, miR-21, miR-34a, miR-145, miR-1307-3p, and miR-4324 in AHH-1 cells at 24 h after irradiation. Data represent expressed as the mean ± standard deviation of the mean of 3 independent experiments. As compared with 0 Gy group, * p < 0.05.

