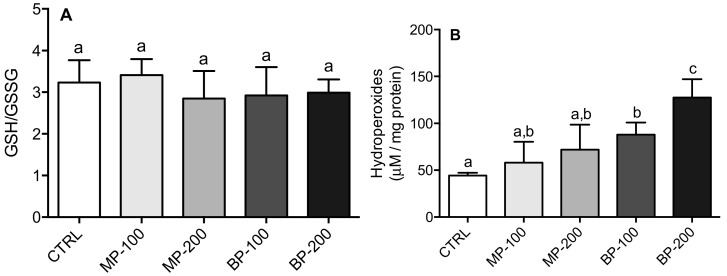
Figure 7.
The glutathione (GSH)/glutathione disulfide (GSSG) ratio (A) and lipid hydroperoxide concentration (B) in the testes of the F1 generation rats. Results are M ± SD of 7–10 independent experiments. The values marked with the same letter are not statistically significant between groups as determined by the Tukey’s post hoc test (p < 0.05).

