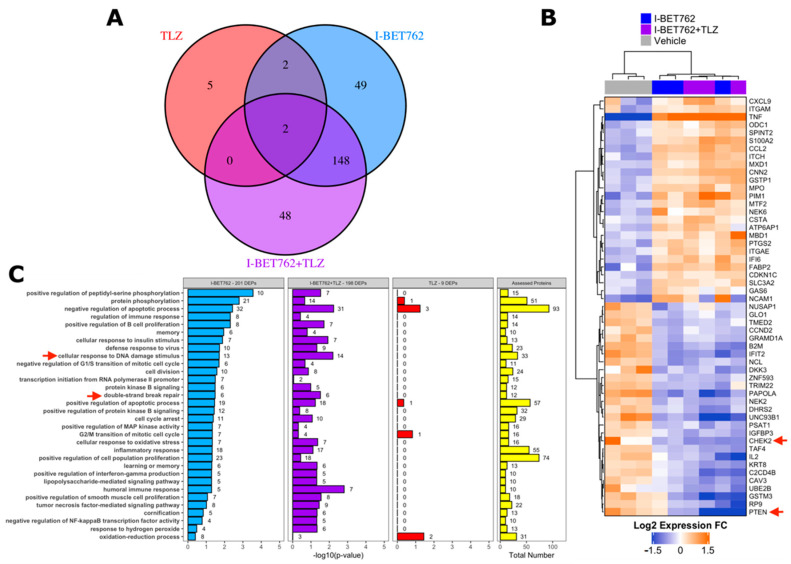
Figure 5.
Cancer-related proteome profile of I-BET762- and Talazoparib-treated Lu135 SCLC cells. (A) Venn diagram of I-BET762-single agent (I-BET762), Talazoparib-single agent (TLZ) or drug combination (I-BET762+TLZ) associated differentially expressed or phosphorylated proteins (DEPs). DEPs were defined by an expression or phosphorylation level difference of at least 30% between treated and untreated cells (fold change at log2 scale > 0.3785 or < −0.3785 and adjusted p-value < 0.05). (B) Heatmap of the top-20 down-regulated (blue) and top-20 up-regulated (orange) proteins following I-BET762 or I-BET762+TLZ treatment. The data presented are mean normalized by row. CHEK2 and PTEN (red arrows) are down-regulated in both I-BET762 and I-BET762 treatment groups. (C) Pathway enrichment analysis of “biological process” Gene Ontology aspect in DEPs. Ontology classes with Fisher exact test p-value < 0.05 in at least one treatment group are shown and ranked based on p-value in I-BET762 treatment group.

