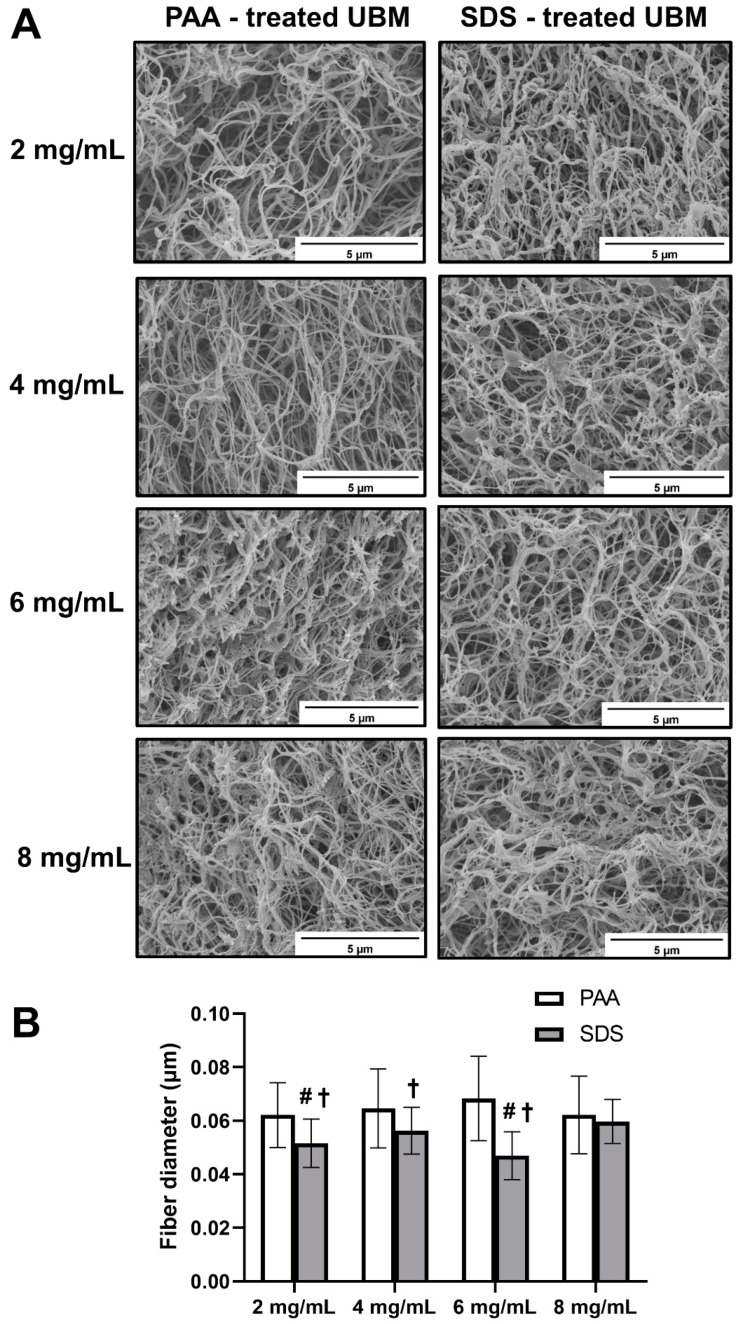
Figure 5.
Hydrogel surface morphology of hydrogel from PAA and SDS groups. Scanning electron micrographs of UBM hydrogel surface (A) (scale bar 5 µm). Fiber size (B) of hydrogels. # denotes statistically difference from the 8 mg/mL concentration of the same decellularization group type, and † denotes statistically difference between PAA and SDS groups at the same concentration (p < 0.05).

