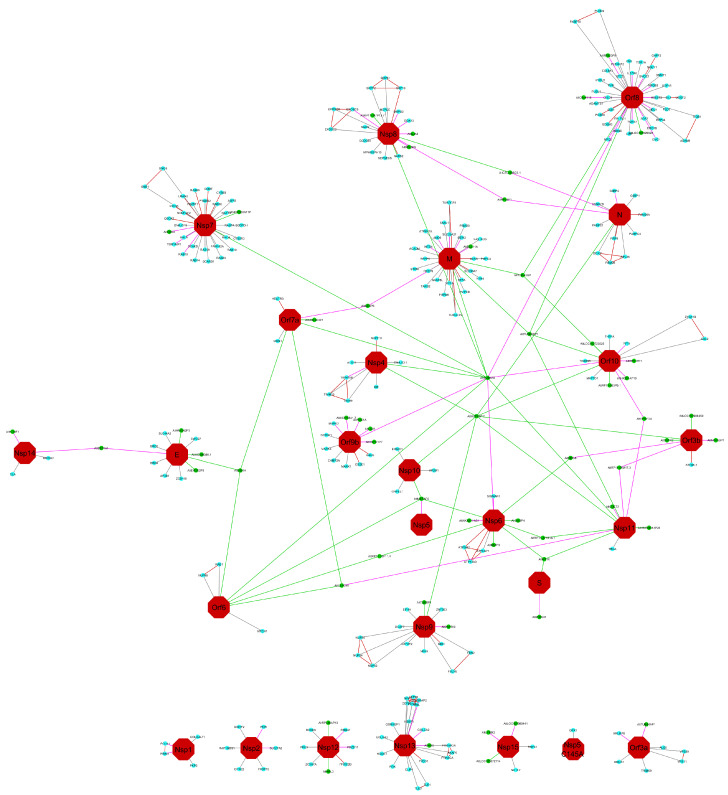
Figure 1.
Viral protein interaction network (SARS-Cov-2) from co-IP experiments [21], re-analyzed by including AltProt, reference protein (RefProt), and viral databases. The previously established network is compared to the new query thanks to the DyNet Analyzer application on Cytoscape V3.8.0. Color legend nodes: red: viral protein (bait), blue: RefProts and green: AltProts, and for the edges: red: interaction not recovered in our analysis, grey are recovered in both analysis, green: specific to our analysis and with a ratio < 100, purple edges are interaction specific to our analysis with a ratio of 100.

