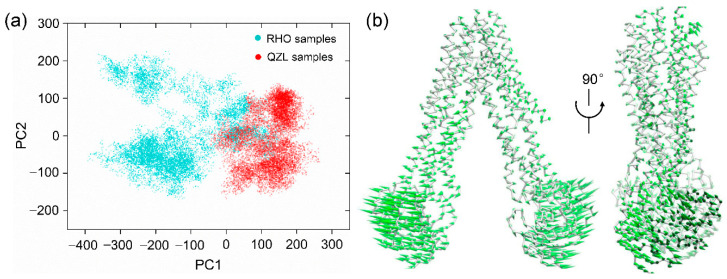
Figure 2.
Principal component analysis (PCA) of equilibrium trajectories. (a) The distribution of conformational samples in the first two principal components. (b) Directions of motion along PC1 represented by porcupines. The average structure of P-gp was shown as ribbon. For clarity, the reverse direction was not shown.

