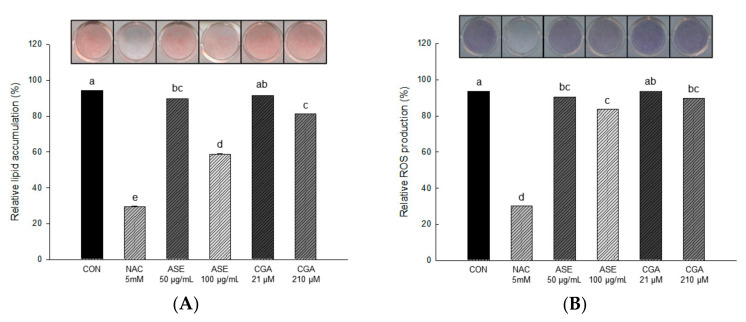
Figure 5.
The effect of ASE and CGA on lipid accumulation (A) and reactive oxygen species (ROS) production (B) in 3T3-L1 adipocyte during the adipogenesis. After 6 days of MDI treatment, accumulated lipids were stained with oil red O (ORO) and absorbance was measured at 470 nm. ROS production was stained with nitroblue tetrazolium test (NBT) solution and absorbance was measured at 570 nm. Control group (CON), control cells which were differentiated with MDI; N-acetyl-L-cysteine (NAC), positive control cells which differentiated with MDI in the presence of NAC. Each value is expressed as the mean ± SD of triple determination. The other letters on the bars indicate a significant difference of p < 0.05 in the Duncan multi-range test. a, c, d, e, ab and bc significant differences among various parts of samples.

