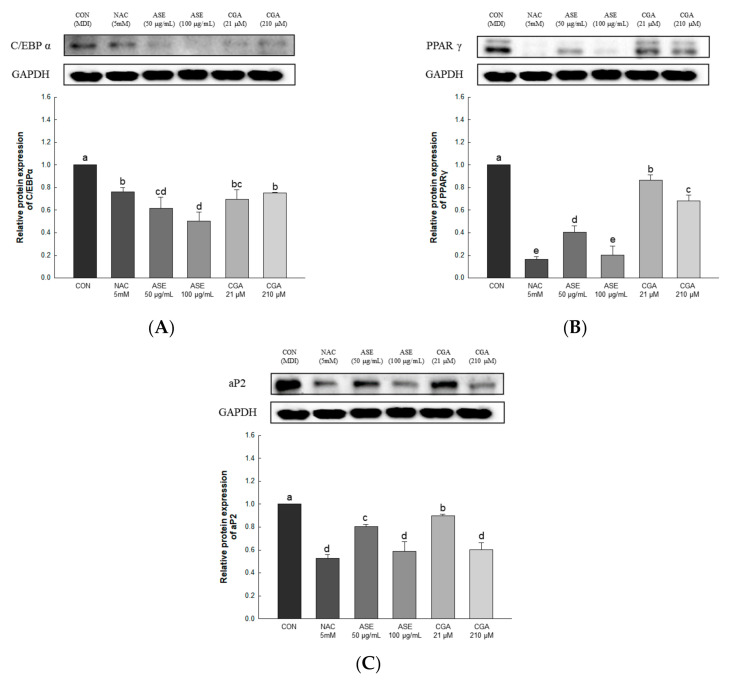
Figure 8.
Effects of ASE and CGA on the expression level of adipogenic transcription factor in 3T3-L1 adipocyte. Protein expression of C/EBPα (A), PPARγ (B), and aP2 (C). 3T3-L1 adipocytes differentiated for 6 days were treated with ASE (50 and 100 μg/mL) and CGA (21 and 210 μM). Protein expression was quantified through western blotting and normalized through GAPDH expression level. Each value is expressed as the mean ± SD of triple determination. The other letters on the bars indicate a significant difference of p < 0.05 in the Duncan multi-range test. a, b, c, d, e, bc and cd significant differences among various parts of samples.

