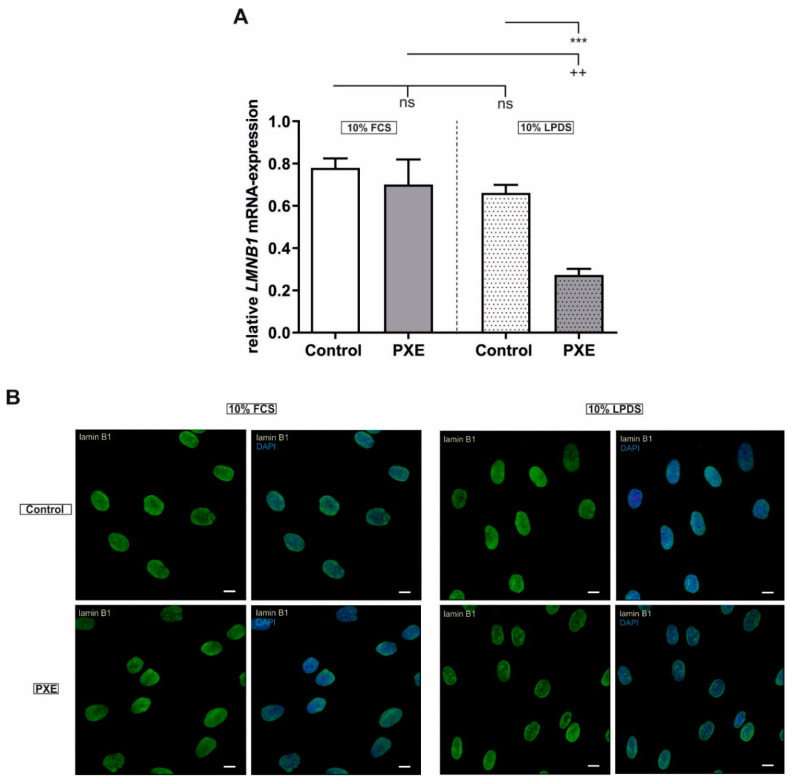
Figure 2.
Relative LMNB1 mRNA-expression and immunofluorescence microscopy of lamin B1 for PXE fibroblasts and NHDF (A) Relative LMNB1 mRNA-expression of PXE fibroblasts (gray, n = 3) and NHDF (white, n = 3) after 24 h cultivation in 10% FCS or 10% LPDS. Data are shown as mean ± SEM. Control/PXE: *** p ≤ 0.001; ns p > 0.05. 10% FCS/ 10% LPDS: ++ p ≤ 0.01; ns p > 0.05. (B) Immunofluorescence microscopy of lamin B1 (green) for PXE fibroblasts (n = 3) and NHDF (n = 3) after 72 h cultivation in 10% FCS or 10% LPDS. Cell nuclei were counterstained with DAPI (blue). Representative images are shown. Scale bar: 10 µm.

