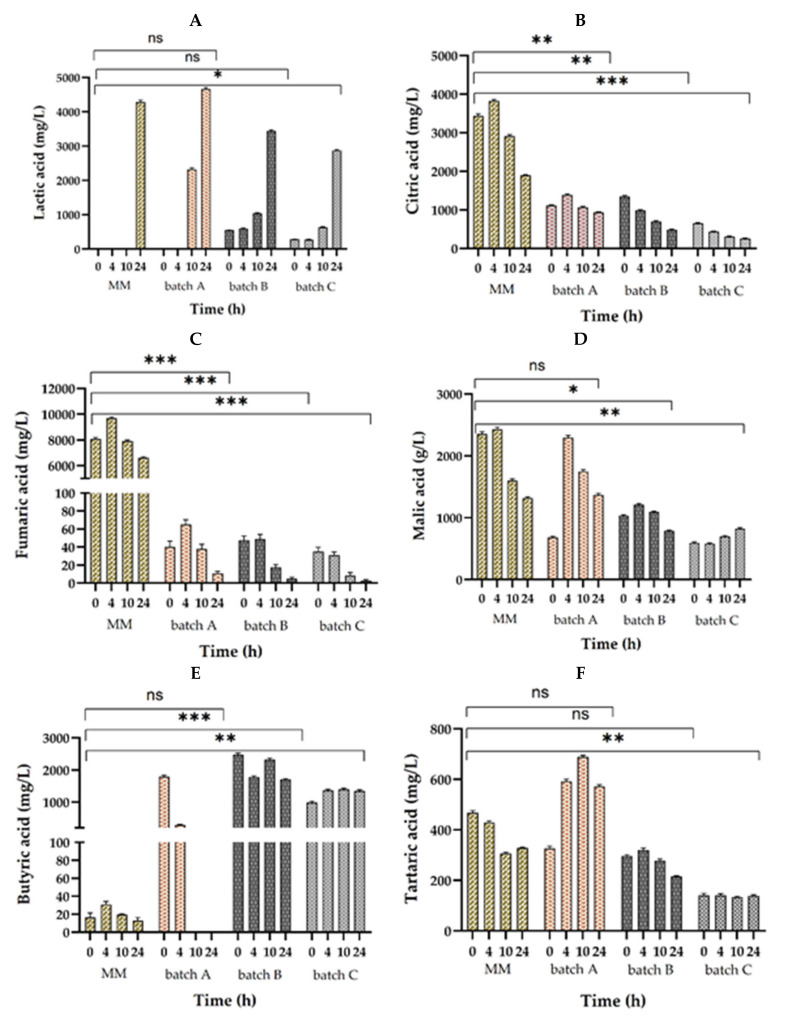
Figure 4.
Organic acid production through 24 h fermentation with the cocultures LP and LC in MM (model media—control); batch A (90% WF and 10% SF), B (95% WF and 5% SF), and C (100% WF); (A) lactic acid, (B) citric acid, (C) fumaric acid, (D) malic acid, (E) butyric acid, and (F) tartaric acid. Values displayed as mean ± SD of the triple measurements and symbols (ns, *, **, ***) express the not-significant or significant differences (p < 0.05) between the MM and the three batches (one-way analysis of variance (ANOVA), multiple comparison tests).

