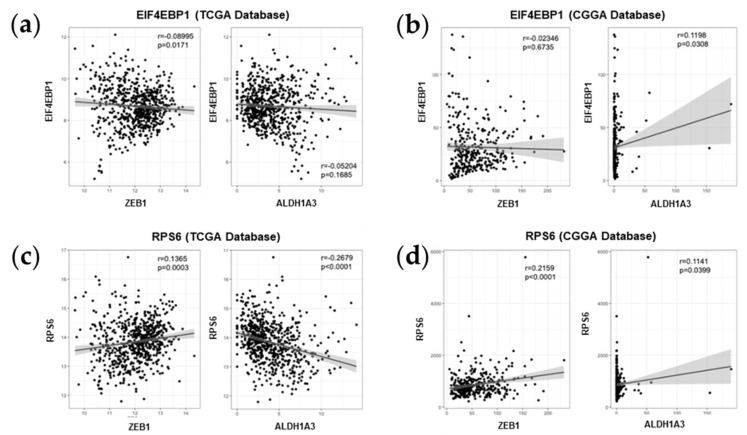
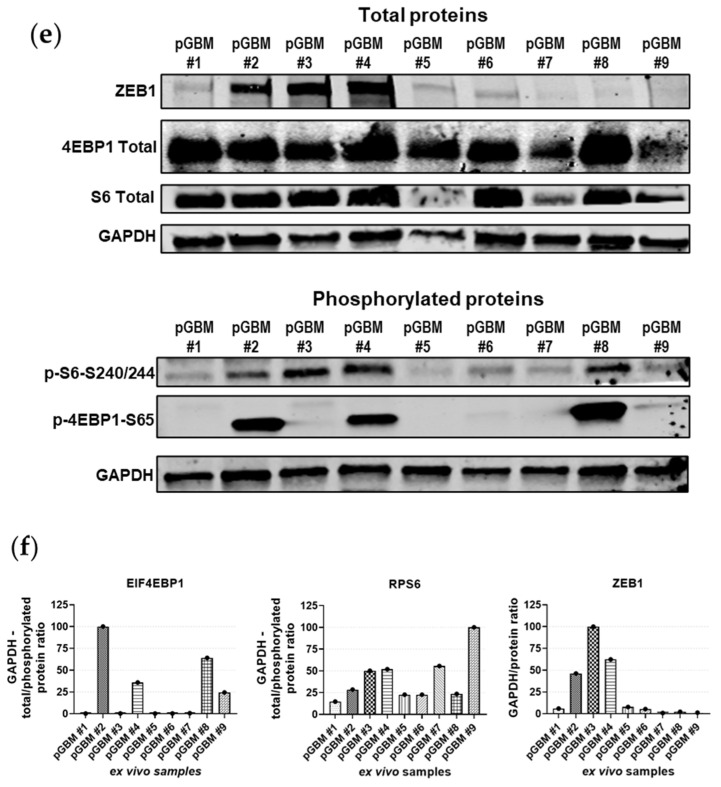
Figure 5.
Bio-informatic in silico analysis. (a) TCGA EIF4EBP1 mRNA data, (b) CGGA EIF4EBP1 mRNA data, (c) TCGA RPS6 mRNA data, (d) CGGA RPS6 mRNA data, (a–d) the graphs were organized from left to right as ZEB1 and ALDH1A3, (e) protein expression on surgical samples, (f) all proteins are normalized to loading control (GADPH), for EIF4EBP1 and RPS6 the ratio between total protein and phosphorylated form are calculated. The significance of the difference between the groups of data was analyzed by unpaired T test.


