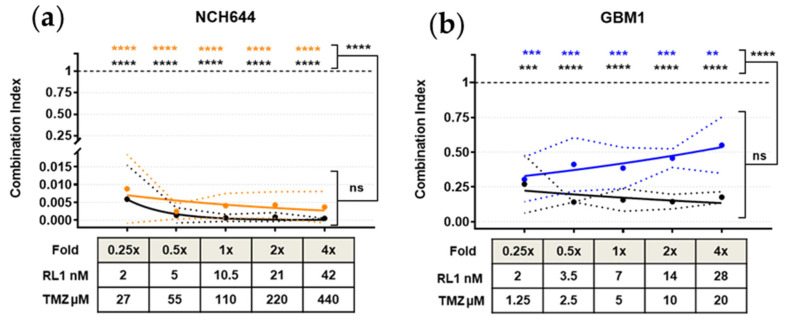
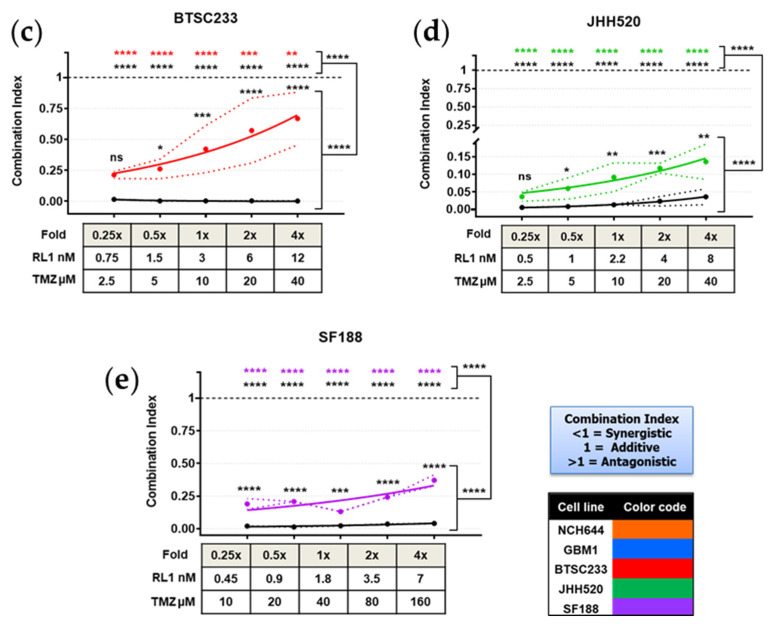
Figure 6.
Synergistic effect of RL1, TMZ, and TTFields. (a–e) All color coded GSCs according to RL1 IC50 value showed a significant synergistic effect when combining RL1 with TMZ (colored lines), and an increased significant synergistic effect when adding TTFields to the combination. Under each figure, there is a small table with the multiplication fold values of RL1 and TMZ. The statistical test performed was one-way-ANOVA. The significance of the difference between groups was described as * p < 0.05, ** p < 0.01, *** p < 0.001, **** p < 0.0001.


