Figure 2.
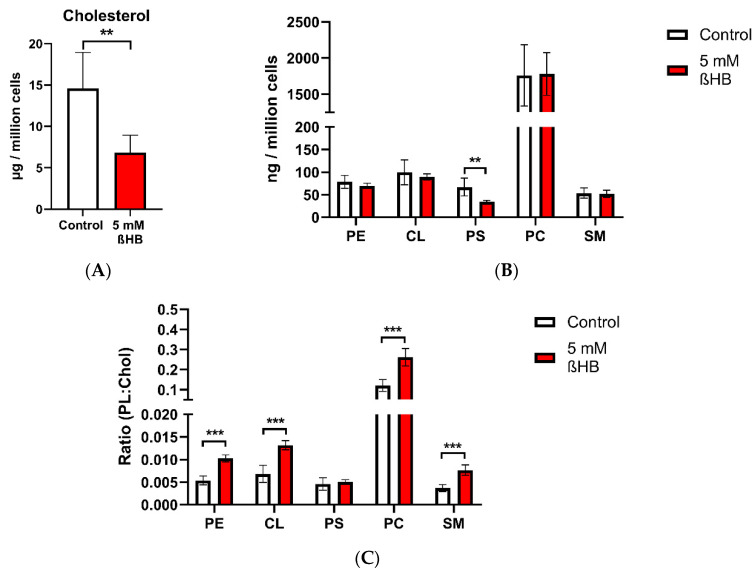
Cellular lipid quantities in HT22 neurons (control and ßHB-treated). Graph (A) represents cholesterol quantity (in µg per one million cells) measured using HPLC; graph (B) represents cellular phospholipid quantities (in ng per one million cells), measured using HPTLC; graph (C) represents the ratios of individual phospholipids to cholesterol in the control and beta-hydroxybutyrate-treated groups. Data are presented as mean + SD (n = 4–6); ** p < 0.01, *** p < 0.001. Chol—cholesterol; CL—cardiolipin; PC—phosphatidylcholine; PE—phosphatidylethanolamine; PL—phospholipid; PS—phosphatidylserine; SM—sphingomyelin.

