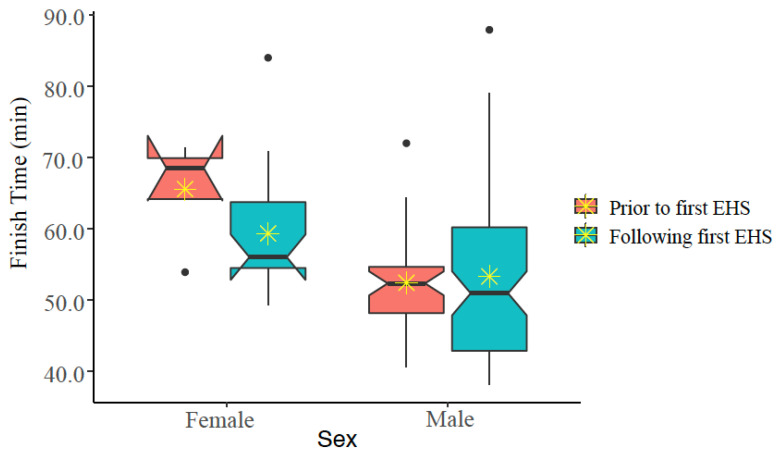
Figure 6.
Notched box plot of finish times prior to and following first exertional heat stroke (EHS) episode at the Falmouth Road Race for those having more than one EHS at this race. The box represents the interquartile range, spanning the 25 to 75 percentiles of the data. * indicates mean of the data. The line shows the median of the data, and the ends of each notch represent the 95% confidence interval of the median. Notches on the boxplots overlap for males, but not females, suggesting that FT are not statistically significantly different for males, but that FT is significantly different for females (at alpha ≤ 0.050).

