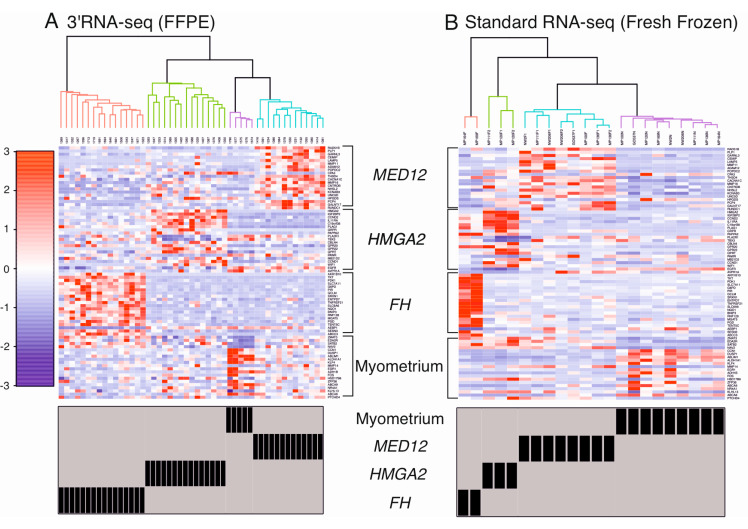
Figure 3.
Supervised hierarchical clustering analysis using a set of 80 selected genes. (A) Hierarchical clustering analysis revealed that the 49 FFPE samples clustered into four distinct groups, representing the three most common leiomyoma subtypes and myometrium controls. (B) The same clustering analysis was performed with an independent dataset of 22 fresh frozen samples that were sequenced using standard RNA sequencing [14], revealing four similar groups. Two of the fresh frozen samples, originally classified as HMGA1 overexpressing leiomyomas (MP164F, MP169F), displayed expression patterns of leiomyomas of the FH subtype.

