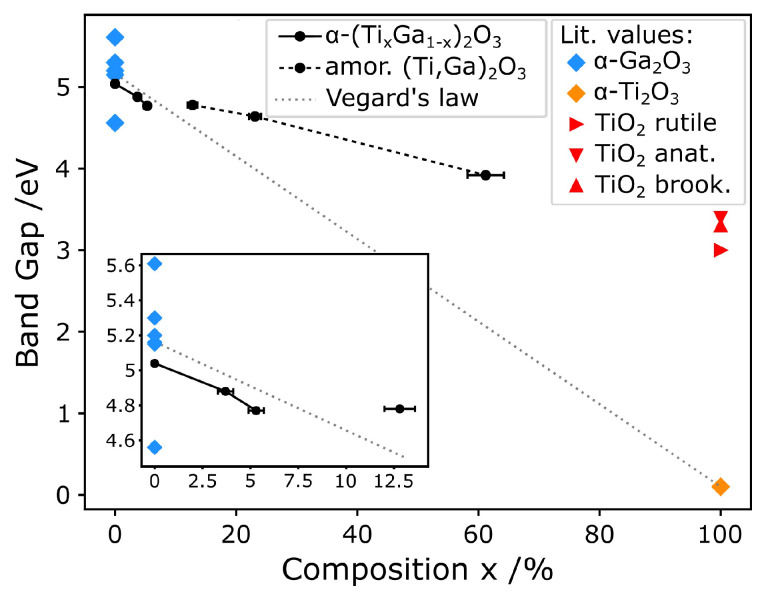
Figure 5.
Plot showing the measured variation of band gap energy with the RBS composition alongside literature values of band gaps for pure oxides [1,2,3,4,5,30,56,57,58,59,60,61,62] and a Vegard’s law trend between -Ga2O3 and -Ti2O3. The inset is an enlargement of the low Ti fraction region. The plot also differentiates between compositions based on whether crystallinity was observed by XRD.

