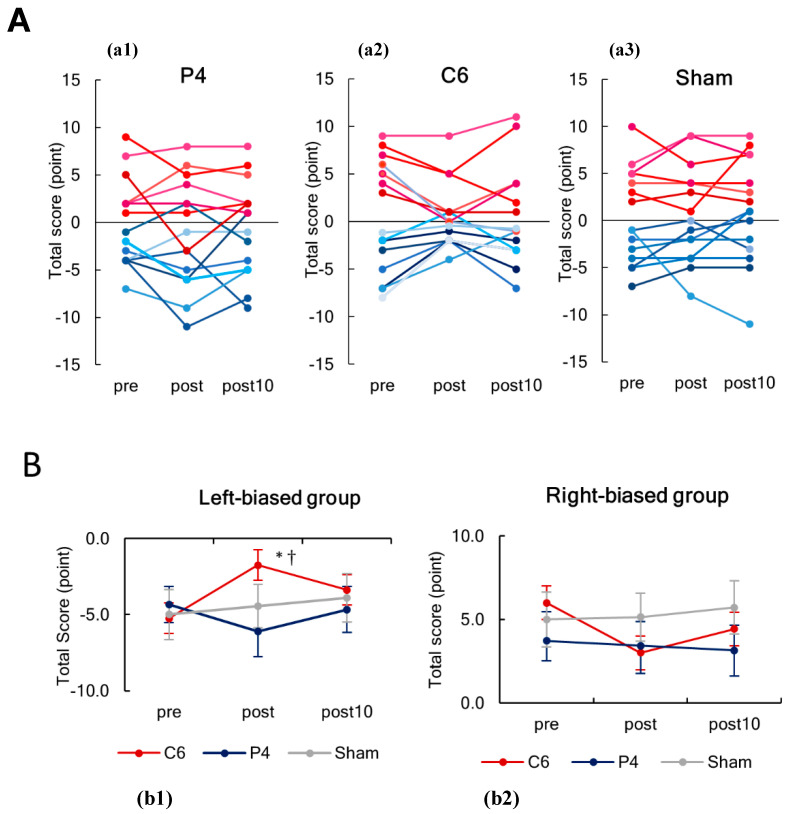
Figure A1.
These figures show results without an outlier from the left-biased group. (A) Serial changes in the individual total scores of line length judgement task before (pre), immediately after (post), and 10 min (post 10) after tSMS for 20 min. Scatter plots present the individual values for each stimulation condition: (a1) P4, (a2) C6 and (a3) sham stimulation. Nine subjects showed a rightward bias (reddish lines), and seven subjects showed a leftward bias (blue lines). (B) Serial changes in the total scores of line length judgement task before (pre), immediately after (post), and 10 min (post 10) after tSMS for 20 min, separately presented for the left-biased group (b1) and right-biased group (b2). In the left-biased group, the magnitude of bias was significantly reduced immediately after tSMS over C6, and the bias was significantly smaller for C6 as compared to P4 at post. * p < 0.001 vs. pre, † p < 0.05 vs. tSMS over P4.

