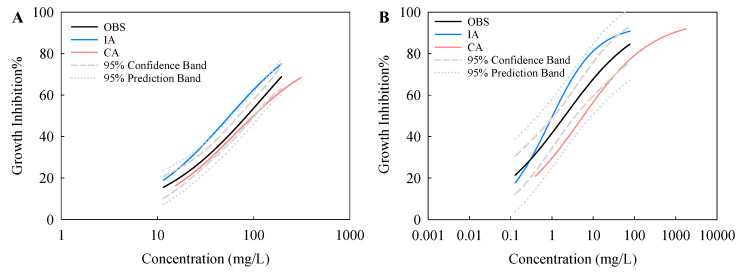
Figure 5.
Comparison between regression models of the observed (OBS) combined nanotoxicity and expected toxicity of the mixtures to Scenedesmus obliquus (A) and Chlorella pyrenoidosa (B) according to concentration addition (CA) and independent action (IA). The dashed-line and dotted-line represent the 95% confidence band and 95% prediction band of the experimental data points, respectively.

