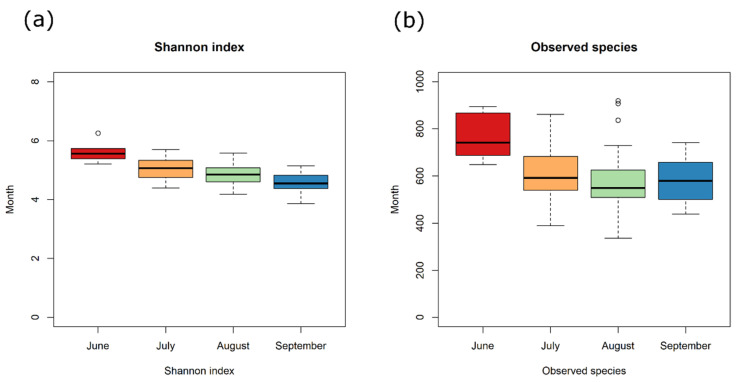
Figure 1.
A. Shannon Index (a) and number of Observed OTUs (b) over time. Samples are labelled according to month (June, July, August, and September). Boxes represent the interquartile range (IQR) between the first and third quartiles, and the line inside represents the median (2nd quartile). Whiskers denote the lowest and the highest values within IQR from the first and third quartiles, respectively. Circles represent outliers beyond the whiskers.

