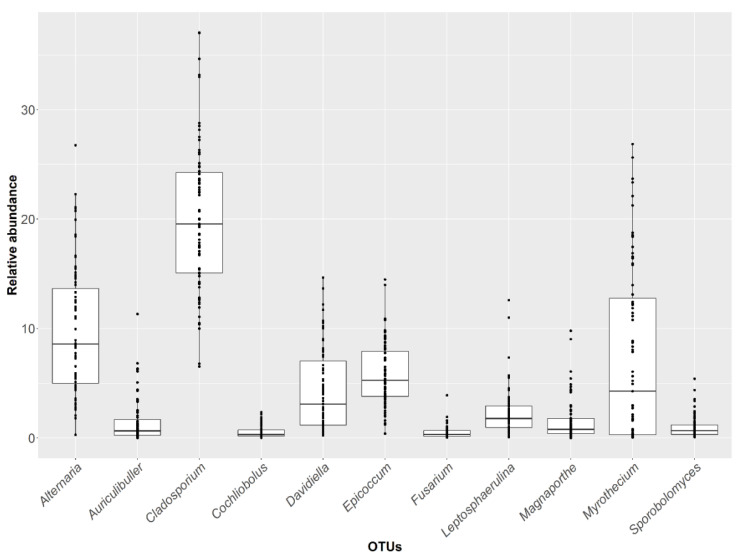
Figure 2.
Abundance (%) over time of the 14 genera within the OTU core corresponding to the OTU core identified in 83.5% of the samples. Boxes represent the interquartile range (IQR) between the first and third quartiles, and the line inside represents the median (second quartile). Whiskers denote the lowest and the highest values within 1.56 IQR from the first and third quartiles, respectively. Circles represent outliers beyond the whiskers.

