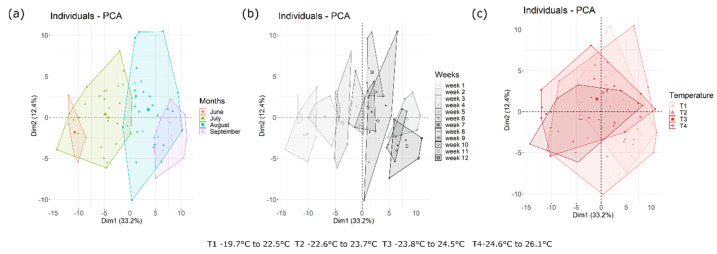
Figure 3.
Principal component analysis (PCA) based on OTU table. Samples are grouped according to month (a), week (b) or temperature (c). Week 1 and 2 correspond with the period between 25 June 2016 to 4 July 2016, weeks 3, 4 and 5 correspond with the period between 4 July 2016 to 24 July 2016, weeks 6, 7, 8 and 9 correspond with the period 24 July 2016 to 22 August 2018, whilst the last three weeks are from 22 August 2016 to 12 September 2016. The first component (horizontal) accounts for 33.2% of the variance and the second component (vertical) accounts for 12.4%.

