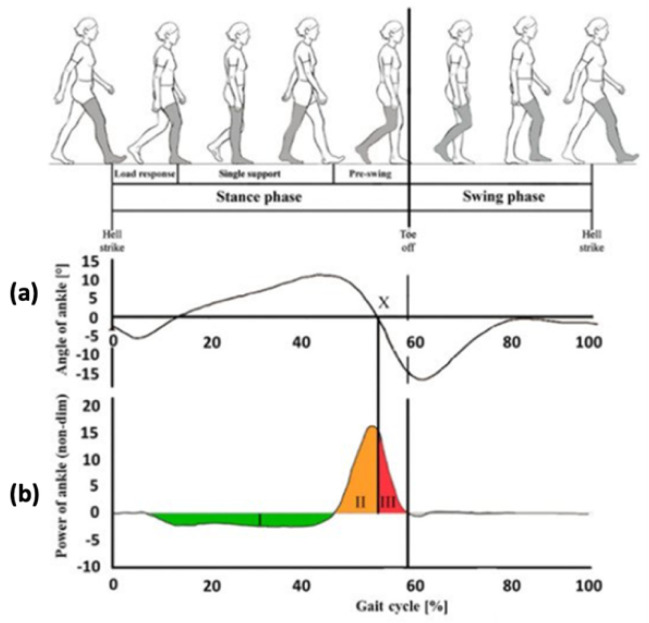
Figure 1.
(a) Diagram of the ankle angle in the gait of a healthy individual and (b), corresponding diagram of the power of the ankle, rendered dimensionless. I is the area with negative power, starting from the heel strike; II is an amount of the area with positive power corresponding to the thrust phase; III is the remaining amount of the area with positive power, corresponding at the final stage of the stance phase in a healthy individual; X is the point in which the foot loses contact with the ground, in the case of a user with an ESR foot.

