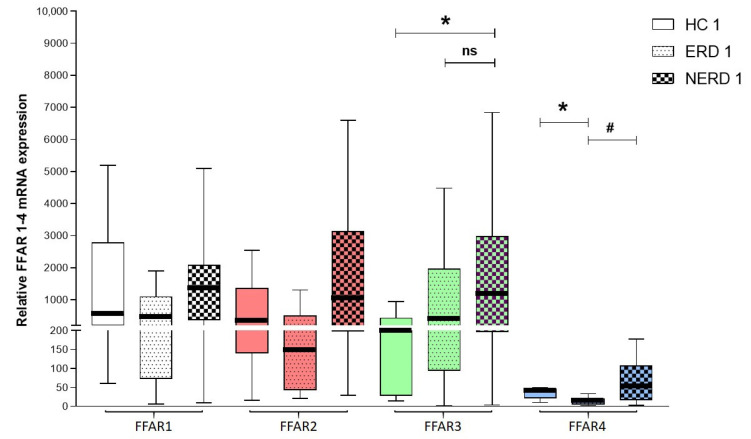
Figure 2.
The relative expression of FFAR1, FFAR2, FFAR3, and FFAR4 in HCs (HC1–4, n = 8), patients with erosive reflux disease (ERD) (ERD 1–4, n = 12-15), and patients with nonerosive reflux disease (NERD) (NERD 1–4, n = 32-36). Expression was compared with the HPRT1 reference gene. The Kruskal–Wallis test was used to compare the values. ns—non significant * p < 0.05 as compared to respective control, # p < 0.05 as compared to ERD.

