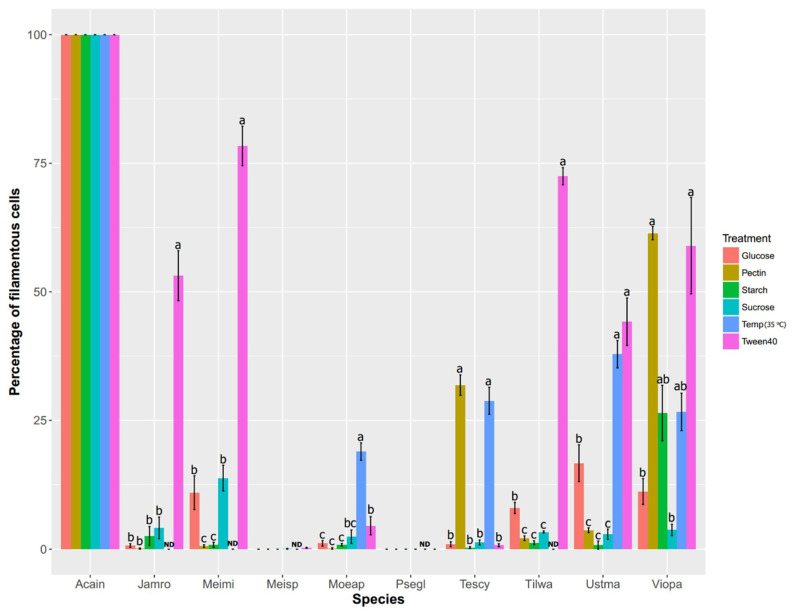
Figure 2.
Growth form quantification of ten Ustilaginomycotina species supplied with different carbon sources (red, gold, green, aqua and pink) and high temperature (blue). This figure is a statistical representation of data from Figure 1. The growth form is reported as percentages of filamentous cells. One-way analysis of variance (ANOVA) was used to test differences among treatments for each species. Letters indicate statistical groups inferred from the Tukey HSD post-hoc test, with ‘a’ as the highest value, ‘b’ as an intermediate value and ‘c’ as the lowest value. ND: no data, meaning that fungi do not grow in those conditions. Species abbreviations are as indicated in the Figure 1 legend.

