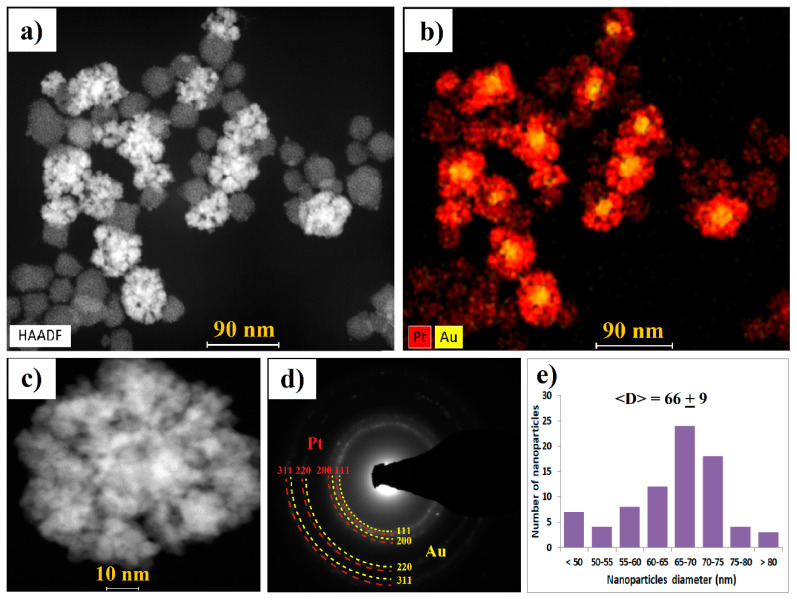
Figure 3.
Morphology of AuPt NCs: (a) scanning transmission electron microscopy (STEM) High-angle annular dark-field detector (HAADF) overview image, (b) energy dispersive X-ray spectroscopy (EDS) distribution map of gold (yellow) and platinum (red) in AuPt NCs, (c) STEM HAADF higher magnification image, (d) corresponding selected area electron diffraction (SAED) pattern, and (e) size distribution of AuPt NCs.

