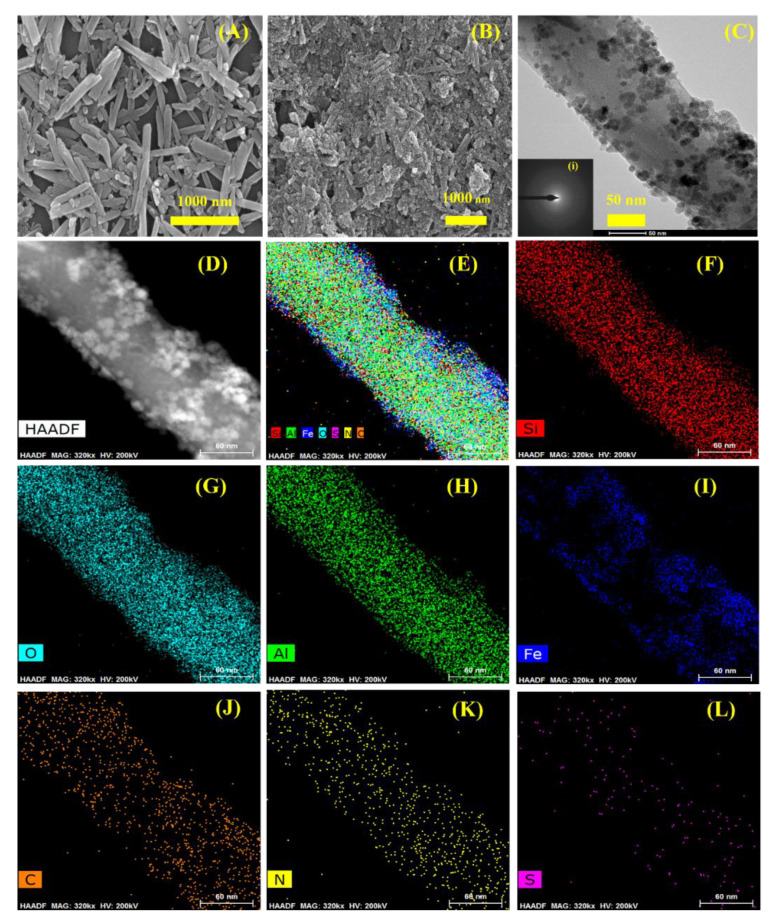
Figure 2.
SEM analysis of (A) HNTs, and (B) HNTs-Fe3O4-CTs-SH. HR-TEM analysis of the HNTs-Fe3O4-CTs-SH (C) inset (i) SAED pattern of the HNTs-Fe3O4-CTs-SH. The STEM HAADF image of HNTs-Fe3O4-CTs-SH (D), elemental mapping of HNTs-Fe3O4-CTs-SH (E), and corresponding elemental distribution of Si (F), O (G), Al (H), Fe (I), C (J), N (K) and S (L).

