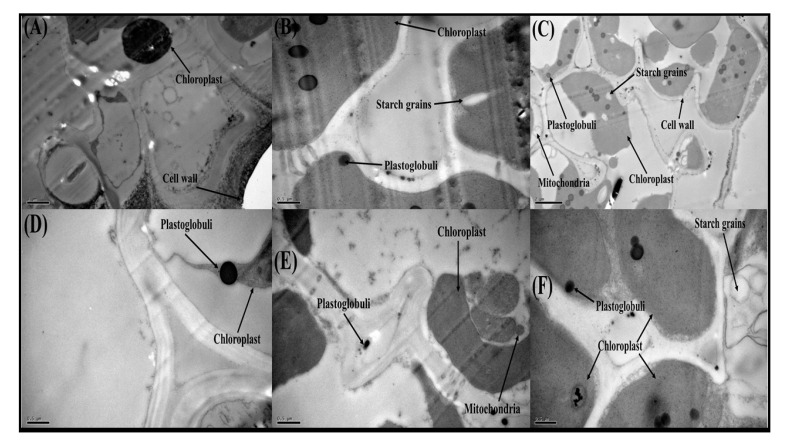
Figure 8.
Transmission electron microscopy (TEM) analysis of Oryza sativa (cultivars) leaf structure after treated with Cd and Fe concentration in the nutrient solution. (A) Shan 63 (5000) with Cd 100 + Fe 0, (B) Shan 63 (2500) with Cd 100 + Fe 50, (C) Shan 63 (10,000) with Cd 100 + Fe 100, (D) Lu 9803 (2500) Cd 100 + Fe 0, (E) Lu 9803 (2500) Cd 100 + Fe 50 and (F) Lu 9803 (2500) Cd 100 + Fe 100.

