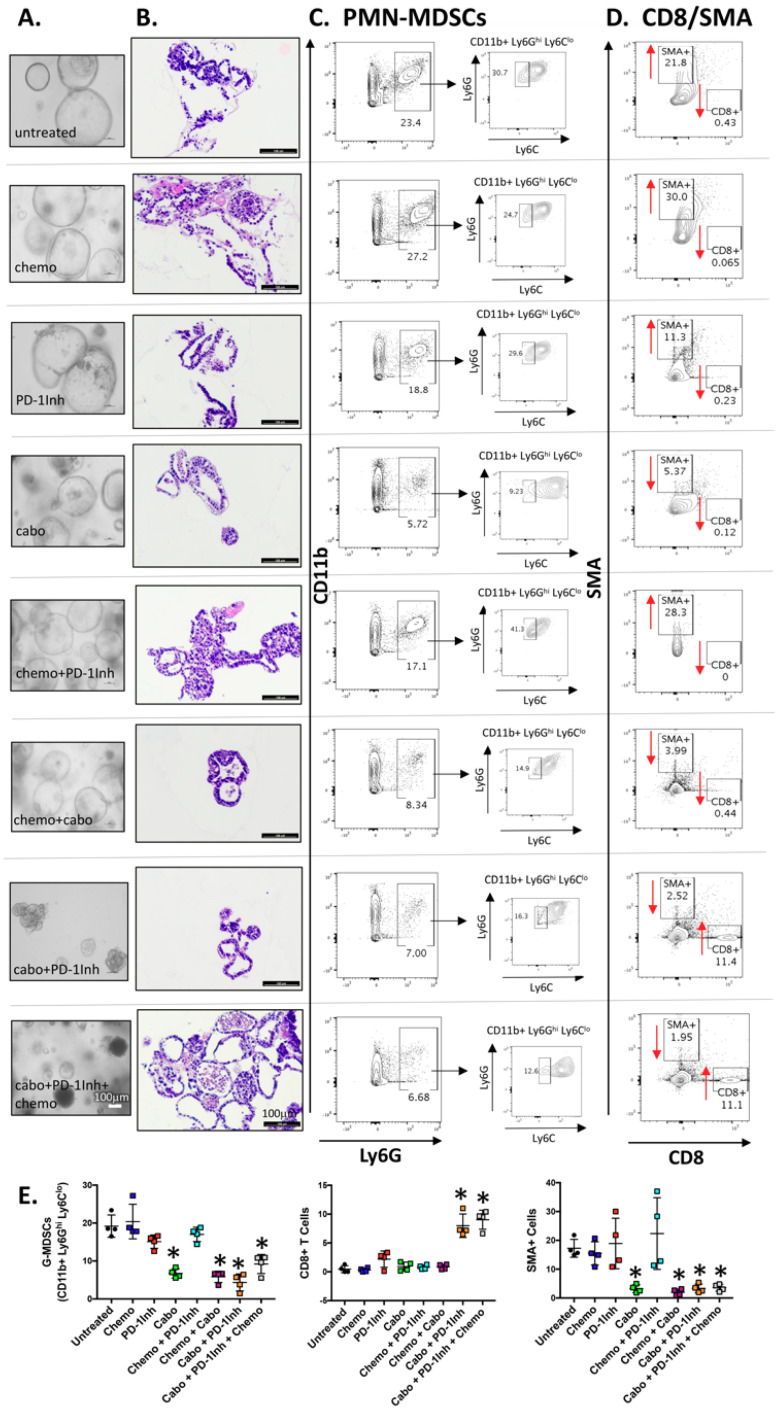
Figure 2.
Changes in PMN-MDSC, CD8 and SMA cell compartments in organoids directly derived from mouse tumors in response to experimental treatments. (A) Light micrographs of cultured organoids and (B) H&E staining of embedded organoids that were derived from mouse tumors in response to experimental treatments. Flow cytometric contour plots demonstrating the changes in (C) PMN-MDSC, (D) CD8 and SMA cell populations in organoids derived from mouse tumors in response to experimental treatments. Quantification (% cell populations) is shown in (E). * p < 0.05 compared to untreated; n = 10 mice per group.

