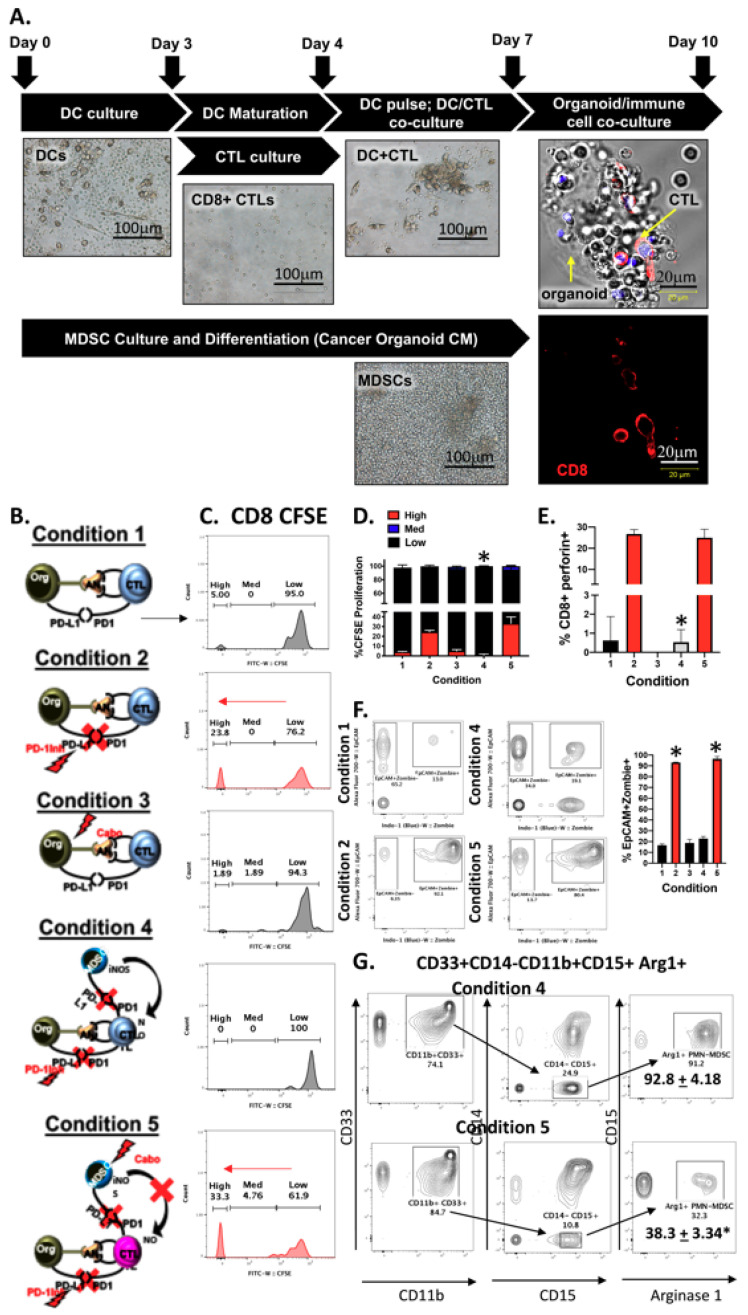
Figure 7.
Analysis of patient-derived autologous PDAC organoid/immune cell co-cultures. (A) Light micrographs of representative images of patent-derived immune cells cultured with PDAC organoids. (B) Schematic representation of experimental conditions 1–5 used in organoid/immune cell co-cultures. (C) Histograms generated from CFSE T cell proliferation assays using co-cultures under treatment conditions 1–5. Percent of (D) proliferating CTLs, and (E) CD8+perforin+-expressing cells in co-cultures under treatment conditions 1–5. (F) Representative contour plots were quantified for changes in EpCAM+PD-L1+ zombie (dead) tumor cells within co-cultures under treatment conditions 1–5. (G) Representative contour plots were quantified for changes in arginase 1 expression in PMN-MDSCs within co-cultures under treatment conditions 1–5. * p < 0.05; n = 10 individual patient-derived co-cultures.

