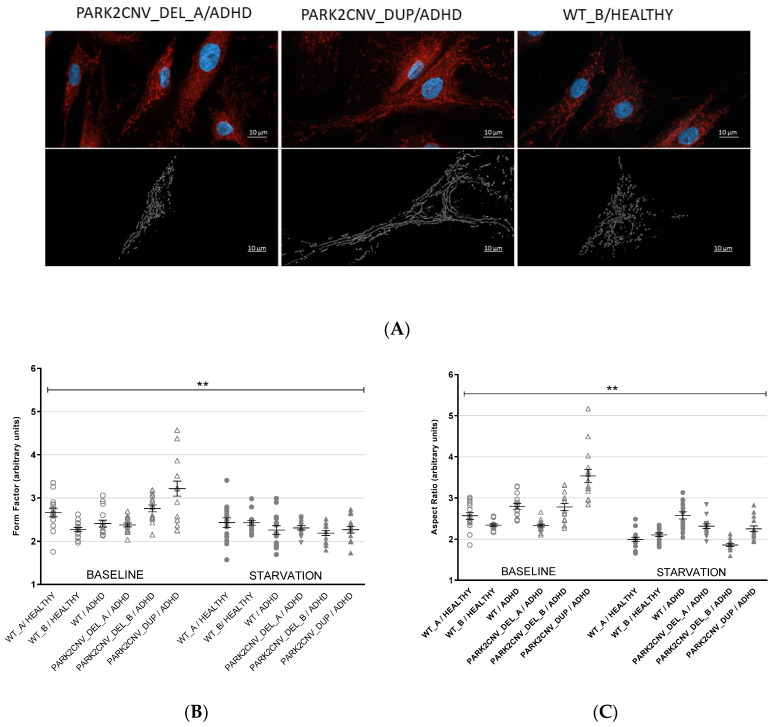
Figure 1.
(A–C): Mitochondrial network analysis. (A) Mitochondrial staining (MitoTracker Red CMXRos) in fibroblast cell lines under baseline conditions, and mask of the semi-automated digital image analysis (Fiji/ImageJ) showing different types of network morphology. These images demonstrate a tubular elongated mitochondrial shape (PARK2CNV_DUP/ADHD) and a fragmented round-shaped mitochondrial network (WT_B/HEALTHY and PARK2CNV_DEL_A). Scale bars 10 µm. Graphical representation of the form factor (FF) (1B) and Aspect ratio (AR) (1C). The values were obtained by analyzing 15 cells per line/condition from two independent experiments. The dots represent the mean AR and FF values of all the mitochondria present in each fibroblast cell. In both cases there seem to be a more elongated mitochondrial shape and tubular branching in the PARK duplication carrier (PARK2CNV_DUP/ADHD) compared to the other cells (PARK2CNV_DEL_A/ADHD, PARK2CNV_DEL_B/ADHD, WT_A. WT_B/HEALTHY as well as WT/ADHD). ANOVA was calculated, level of significance was set at p = 0.05. ** p ≤ 0.01. Data are shown as mean ± SEM.

