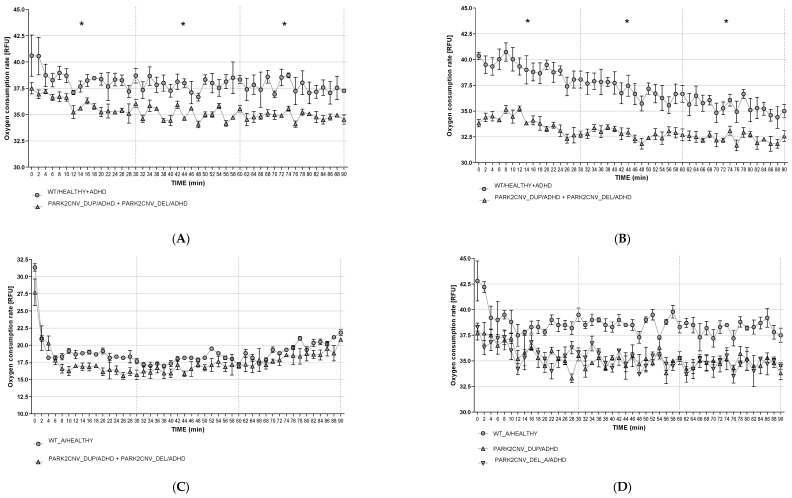
Figure 4.
(A–F): Oxygen consumption rate in human-derived fibroblasts (HDF). Basal oxygen consumption was measured under baseline (A,D), starvation (B,E), and CCCP treatment conditions (C,F). Fluorescence (RFU-y-axis) signal correlating with the respiration was recorded every two minutes for 90 min. Data are presented as mean of two independent experiments with samples measured in triplicate. Figure 4A–C show a combined analysis of PARK2 CNV deletion + duplication vs. wildtype healthy+ADHD wildtype to increase number of HDF cell lines and statistical power). HDF derived from ADHD patients carrying PARK2 CNVs showed lower rates of extracellular oxygen consumptions compared to WT in all the intervals both under baseline conditions (I0–30: CNV carriers (M = 36.056; SD = 0.106), WT (M = 38.493; SD = 1.276); I30–60: CNV carriers (M = 35.026; SD = 0.068), WT (M = 37.859; SD = 1.209); I60–90: CNV carriers (M = 34.841; SD = 0.293), WT (M = 37.626; SD = 1.279) (see Figure 4A) and after starvation (I0–30: CNV carriers (M = 34.938; SD = 1.267 ), WT (M = 39.160; SD = 1.398); I30–60: CNV carriers (M = 33.907; SD = 1.296), WT (M = 36.970; SD = 1.527); I60–90: CNV carriers (M = 33.593; SD = 1.427), WT (M = 35.430; SD = 1.265). Figure 4D–F shows the data of HDF cell lines from PARK2 CNV duplication vs. deletion vs. wildtype healthy control separately. There was a significant difference between the genotypes in all intervals in baseline: I0–30: t(4) = 3.292, p = 0.030, d = 2.692, r = 0.803; I30–60: t(4) = 4.054, p = 0.015, d = 3.310, r = 0.856; I60–90: t(4) = 3.675, p = 0.0321, d = 3.001, r = 0.832 and as well after starvation: starvation I0–30: t(4) = 6.224, p = 0.003, d = 5.082, r = 0.931; I30–60: t(4) = 4.351, p = 0.012, d = 3.553, r = 0.871; I60–90:t(4) = 3.842, p = 0.018, d = 3.337, r = 0.843. Data are shown as ± standard error of mean (SEM). Exploratory repeated measure ANOVAs and t-tests were calculated. Level of significance was set at p = 0.05. * p ≤ 0.05.


