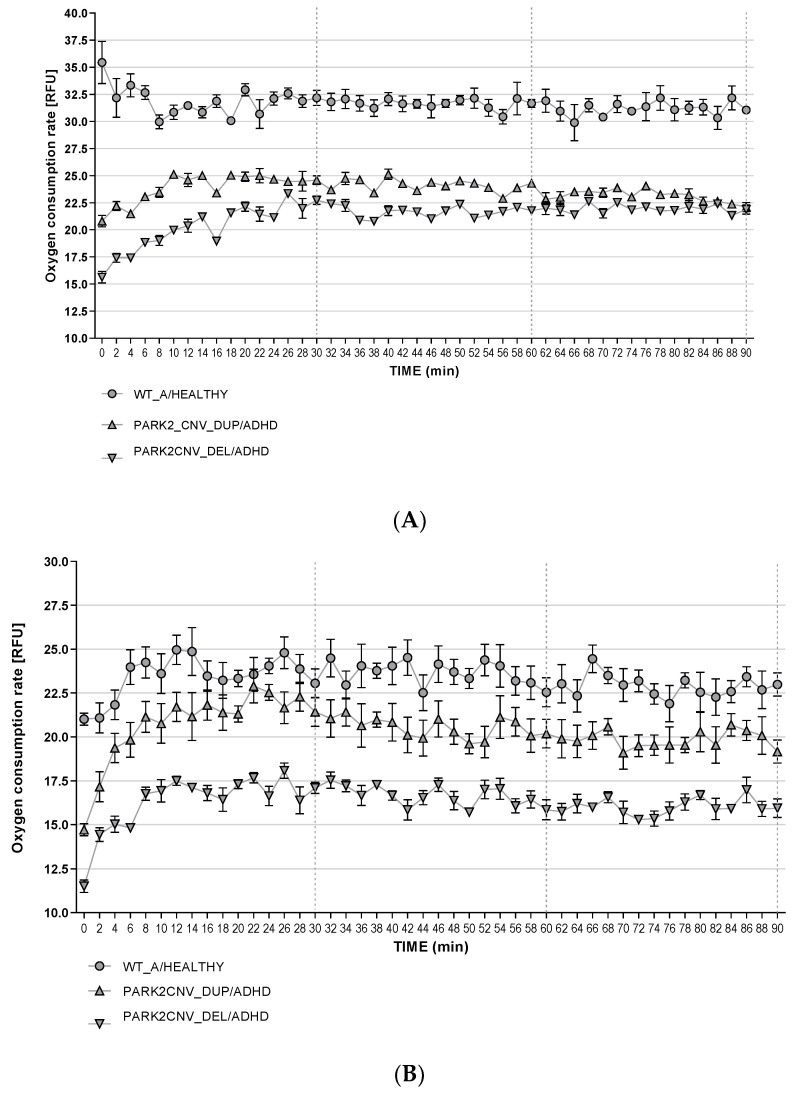
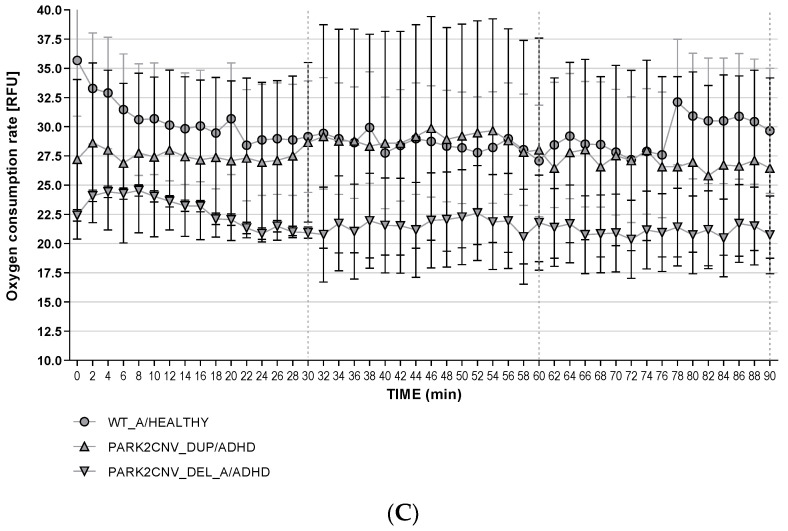
Figure 5.
(A–C): Oxygen consumption rate in mDAN. Basal oxygen consumption rate was evaluated both under baseline (A), starvation (B), and CCCP treatment conditions (C). Fluorescence (RFU-y-axis) signal correlating with the respiration was recorded every two minutes for 90 min. Data are presented as mean of two independent experiments with samples measured in triplicates. Because the biological replicates were n = 1 for each group, the data shown here are only descriptive.


