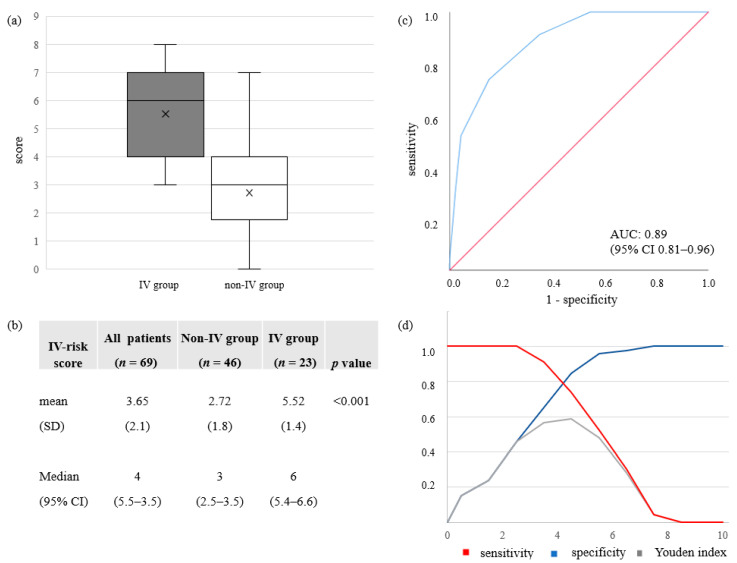
Figure 4.
On admission CT IV-risk score analysis. (a)/(b) Descriptive statistics for the developed IV-risk score for IV-group and non-IV-group with mean (SD) and median (95% CI). (c) ROC curve for the diagnostic ability of IV-risk score to differentiate between IV and non-IV-groups on admission CT. In ROC analysis the AUC for the diagnostic probability for IV therapy during hospitalization was 0.89 (95% CI 0.81-0.96). (d) Sensitivity, specificity and Youden indices are displayed for different IV-risk scores. Optimal cut-off value based on a maximized Youden index was an IV-risk score of 5 with a sensitivity of 0.81 and a specificity of 0.85. An IV-risk score of 4 resulted in a sensitivity of >0.9 and a specificity of >0.65.

