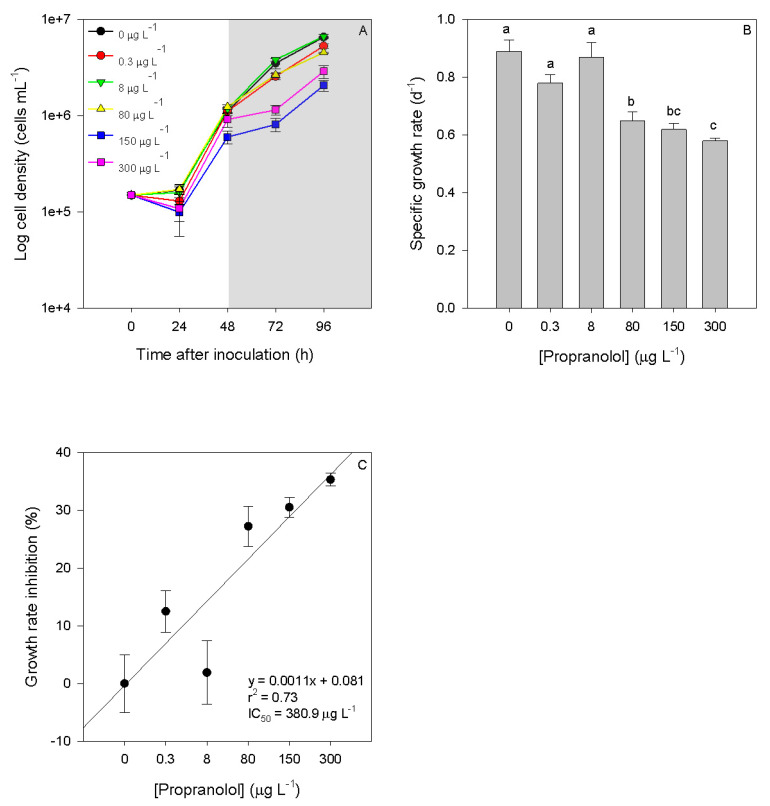
Figure 1.
Growth curves ((A), grey area corresponds to the exposure period), specific growth rate (B) and growth inhibition percentages (C) of Phaeodactylum tricornutum cultures exposed to different propranolol concentrations (average ± standard error, n = 3, letters denote differences at p < 0.05).

